


What graphs show REM and how?


-
wardmiller
- Posts: 294
- Joined: Mon Sep 17, 2012 6:29 pm
- Location: Upstate New York
What graphs show REM and how?
I download the S9 ResMed data to ResScan and SleepyHead each morning. How do I find when I am having REM, which graphs, what indication?
_________________
| Mask: Quattro™ FX Full Face CPAP Mask with Headgear |
| Humidifier: S9™ Series H5i™ Heated Humidifier with Climate Control |
| Additional Comments: ResMed VPAP Auto, Series 9 device, with H5i Heated Humidifier; RedMed Mirage Quattro full-face mask. |

Re: What graphs show REM and how?
None of them show REM. The machine doesn't even know if you are awake or not much less which sleep stage.
You can do a guesstimate based on normal sleep cycles though that will get you close.
Here's what a normal hypnogram looks like.
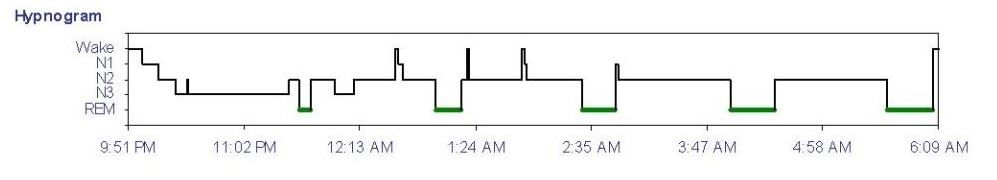
You can do a guesstimate based on normal sleep cycles though that will get you close.
Here's what a normal hypnogram looks like.

_________________
| Machine: AirCurve™ 10 VAuto BiLevel Machine with HumidAir™ Heated Humidifier |
| Additional Comments: Mask Bleep Eclipse https://bleepsleep.com/the-eclipse/ |
I may have to RISE but I refuse to SHINE.

Re: What graphs show REM and how?
I've been wanting to ask this same question. I see posts on here all the time about people extrapolating their sleep cycles based on SleepyHead data. How do you do the "guesstimate"?Pugsy wrote:None of them show REM. The machine doesn't even know if you are awake or not much less which sleep stage.
You can do a guesstimate based on normal sleep cycles though that will get you close.
Here's what a normal hypnogram looks like.
Thanks
_________________
| Humidifier: S9™ Series H5i™ Heated Humidifier with Climate Control |
| Additional Comments: Pressure 6-12. EPAP 1. |
Re: What graphs show REM and how?
Sometimes people happen to have more OSA events or greater pressure needs during REM stage sleep. It very common.Stanley56 wrote:I see posts on here all the time about people extrapolating their sleep cycles based on SleepyHead data. How do you do the "guesstimate"?
So if we know that we are that way and we see clusters of events that sort of match up with where REM stage sleep cycles are on the graphs...then we have a pretty good idea where REM is.
Otherwise we just have too look at the time frame for each cycle and estimate when REM is likely to happen.
Normally first REM stage comes along around 90 minutes after sleep onset but it can be a little earlier or a little later.
Then as the night goes on REM starts happening sooner and lasting longer with the most REM occurring in the wee hours of the morning right before we wake up.
My OSA is REM dominant.. Much, much worse in REM stage sleep than non REM sleep.
It's not always easy to spot if there isn't much going on but to my way of thinking that's good because it means my OSA events are likely very minimal.
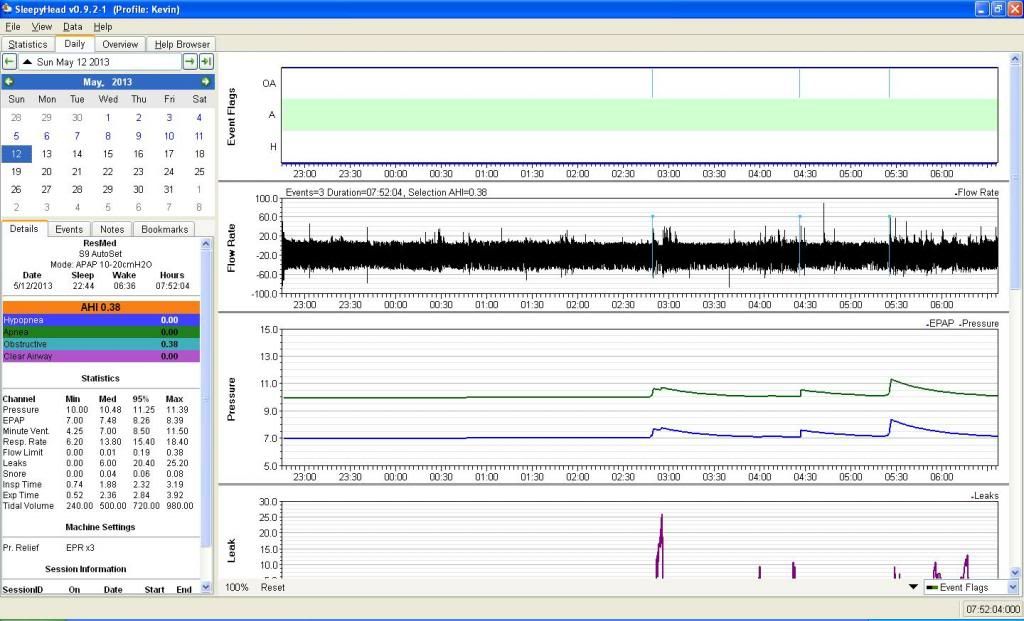
See if you can spot the probable REM stages on this report.

_________________
| Machine: AirCurve™ 10 VAuto BiLevel Machine with HumidAir™ Heated Humidifier |
| Additional Comments: Mask Bleep Eclipse https://bleepsleep.com/the-eclipse/ |
I may have to RISE but I refuse to SHINE.
Re: What graphs show REM and how?
1:30, 3:00 and 5:30?
_________________
| Humidifier: S9™ Series H5i™ Heated Humidifier with Climate Control |
| Additional Comments: Pressure 6-12. EPAP 1. |
Re: What graphs show REM and how?
Yep, and a good chance at 6:15 also.Stanley56 wrote:1:30, 3:00 and 5:30?
It's not always that easy for me to spot. Sometimes no events particularly in any pattern.
Some nights I need more pressure and some nights I don't. I have experimented with supine sleeping and staying off my back by building a wall and I still sometimes see pressure increase during what would likely be REM sleep...sometimes not much of any pressure changes.
Other than using REM as a possible explanation why we might have clusters or maybe need more pressure I don't do much about it. It's not like we can control REM anyway nor would we really want to.
This example above was with fixed pressures and really just happened to occur. I have had nights with same pressures and have essentially just a small handful of events happen and get an AHI less than 1.0.
Just proof that we don't sleep the same every night.
_________________
| Machine: AirCurve™ 10 VAuto BiLevel Machine with HumidAir™ Heated Humidifier |
| Additional Comments: Mask Bleep Eclipse https://bleepsleep.com/the-eclipse/ |
I may have to RISE but I refuse to SHINE.
-
caffeinatedcfo

- Posts: 690
- Joined: Sun Mar 24, 2013 9:19 am
- Location: Upstate NY
Re: What graphs show REM and how?
You're on track. I believe I hit a "wake" cycle religiously between 3-4 hrs of sleep each night. Then I tend to slip into longer REM cycles as demonstrated below (typical night for me lately).
_________________
| Mask: Swift™ FX Nasal Pillow CPAP Mask with Headgear |
| Humidifier: S9™ Series H5i™ Heated Humidifier with Climate Control |
| Additional Comments: SleepyHead software; using APAP mode 10-12cm & EPR 3 |
Re: What graphs show REM and how?
I'm not seeing evidence of a wakeup every 3 to 4 hrs nor do I see any changes "demonstrating longer REM cycles). Not saying its not there, just that I don't know what demonstrates longer REM cycles... What should I be looking for in your graphs? Thanks.
caffeinatedcfo wrote:You're on track. I believe I hit a "wake" cycle religiously between 3-4 hrs of sleep each night. Then I tend to slip into longer REM cycles as demonstrated below (typical night for me lately).
_________________
| Machine: AirSense™ 10 CPAP Machine with HumidAir™ Heated Humidifier |
| Mask: Mirage Quattro™ Full Face CPAP Mask with Headgear |
| Additional Comments: Apap 16 to 18 |
Re: What graphs show REM and how?
I can't confirm REM at all unless I happen to have some clustering of events because that goes along with my history.MyIdaho wrote:just that I don't know what demonstrates longer REM cycles... What should I be looking for in your graphs?
AHI 53 in REM...and 12 in non REM...
I can sometimes see some evidence but most of the time I don't see anything because most of the time my events are well controlled so the absence of anything pretty much confirms a nice normal sleep architecture for me.
Sometimes I will have a little increase in pressure but not always.
I am just happy to know that if I don't see much going on...I am good.
In my case not being able to pinpoint REM means that my machine is doing a good job. I don't worry about the REM stages or their length because I can't really do anything about them anyway. Why worry about something I have no control over.
_________________
| Machine: AirCurve™ 10 VAuto BiLevel Machine with HumidAir™ Heated Humidifier |
| Additional Comments: Mask Bleep Eclipse https://bleepsleep.com/the-eclipse/ |
I may have to RISE but I refuse to SHINE.
-
SomeJoe7777
- Posts: 19
- Joined: Sun Apr 28, 2013 11:24 am
- Location: Houston, TX
Re: What graphs show REM and how?
I have a Zeo Bedside which can show my sleep stage, and I made the following graph using its data combined with some Sleepyhead data:

I made this by taking the Tidal Volume graph from Sleepyhead, and making a sleep stage graph from the Zeo Bedside data in Excel. I then lined up the two images in Photoshop so that the times corresponded.
I can't speak for everyone, but at least for me, REM periods correspond with a more variable tidal volume. (REM periods begin and end at each pair of blue vertical lines). I also tend to take a few deep breaths when I exit a REM period, probably because that's when I change my sleep position. (Red circles show the deep breaths on REM exit).
The tidal volume is more constant during my other stages of sleep, and nearly flat during deep sleep (see 1:30-1:45, 2:45-2:55, and 4:15-4:30).
It's not a perfect correlation, but it's something to go on.
_________________
| Mask: Opus 360 Nasal Pillow CPAP Mask with Headgear |
| Humidifier: S9™ Series H5i™ Heated Humidifier with Climate Control |
-
caffeinatedcfo
- Posts: 690
- Joined: Sun Mar 24, 2013 9:19 am
- Location: Upstate NY
Re: What graphs show REM and how?
Sorry I should've explained my thoughts clearer. Also - these are MY thoughts and NOT scientific proof.MyIdaho wrote:I'm not seeing evidence of a wakeup every 3 to 4 hrs nor do I see any changes "demonstrating longer REM cycles). Not saying its not there, just that I don't know what demonstrates longer REM cycles... What should I be looking for in your graphs? Thanks.
I tend to have a very stable sleep pattern with no OSA - each night - for the first 3-4 hours. To me, this seems to equate to the first two sleep (REM) cycles. I fall asleep quickly so I have no reason to believe I am not getting to REM sleep in appx. 90 minutes.
However, the next 3-4 hours is where I presume I am progressing into the deeper sleep stages and longer REM cycles. I believe my pressure needs increase during these stages, which correlates with my S9 autoset increasing the pressure to combat the OAs that you see above.
These are my views and do not necessarily represent the opinions of my doctor, CPAPtalk.com, Pugsy, RandyJ, or other members of this forum.
_________________
| Mask: Swift™ FX Nasal Pillow CPAP Mask with Headgear |
| Humidifier: S9™ Series H5i™ Heated Humidifier with Climate Control |
| Additional Comments: SleepyHead software; using APAP mode 10-12cm & EPR 3 |
Re: What graphs show REM and how?
Actually I think you are probably spot on with your assessment. Nearly 4 years of auto adjusting pressures for me and for the majority of the time if I see much movement in pressure it's almost always during the second half of the night where we typically have more REM sleep and often more pressure is needed. For me sometimes upwards to nearly 20 cm. Not every time but a good deal of the time. Sometimes I see more pressure needed at the first REM cycle time frame but not nearly as often as in the wee hours of the morning. More time in REM means greater chance for those REM stage apnea events to build up their muscles and need more pressure to kill them.caffeinatedcfo wrote:However, the next 3-4 hours is where I presume I am progressing into the deeper sleep stages and longer REM cycles. I believe my pressure needs increase during these stages, which correlates with my S9 autoset increasing the pressure to combat the OAs that you see above.
_________________
| Machine: AirCurve™ 10 VAuto BiLevel Machine with HumidAir™ Heated Humidifier |
| Additional Comments: Mask Bleep Eclipse https://bleepsleep.com/the-eclipse/ |
I may have to RISE but I refuse to SHINE.
Re: What graphs show REM and how?
people guess their REM periods based on where there are higher leak periods. these are usually longer periods towards the end of the night.
-
caffeinatedcfo
- Posts: 690
- Joined: Sun Mar 24, 2013 9:19 am
- Location: Upstate NY
Re: What graphs show REM and how?
I see this occurring too in the second half of the night. My leaks are virtually zero before the first apnea event.sleepstar wrote:people guess their REM periods based on where there are higher leak periods. these are usually longer periods towards the end of the night.
_________________
| Mask: Swift™ FX Nasal Pillow CPAP Mask with Headgear |
| Humidifier: S9™ Series H5i™ Heated Humidifier with Climate Control |
| Additional Comments: SleepyHead software; using APAP mode 10-12cm & EPR 3 |

Re: What graphs show REM and how?
"Waveform descriptions
By strict sleep staging criteria on polysomnography, REM sleep is defined by (1) rapid eye movements, (2) muscle atonia, and (3) EEG desynchronization (compared to slow wave sleep). Thus, 2 of the 3 defining characteristics are not cerebral waves and theoretically require monitoring of eye movements (electro-oculogram [EOG]) and muscle tone (electromyelogram [EMG]). Fortunately, muscle activity and eye movements can be evaluated on EEG; thus, REM sleep is usually not difficult to identify. In addition to the 3 features already named, "saw tooth" waves also are seen in REM sleep.
•
EEG desynchronization: The EEG background activity changes from that seen in slow wave sleep (stage III or IV) to faster and lower voltage activity (theta and beta), resembling wakefulness. Saw tooth waves are a special type of central theta activity that has a notched morphology resembling the blade of a saw and usually occurs close to rapid eye movements (ie, phasic REM). They are only rarely clearly identifiable.
•
Rapid eye movements: These are saccadic, predominantly horizontal, and occur in repetitive bursts.
Despite the lack of a dedicated EMG channel, the muscle atonia that characterizes REM sleep is usually apparent as a general sense of "quiet" muscle artifacts compared to wakefulness.
Clinical correlation
The duration of REM sleep increases progressively with each cycle and tends to predominate late in the sleep period into early morning. The occurrence of REM too soon after sleep onset, referred to as SOREMP, is considered pathological. However, newborns and infants enter REM more rapidly and spend a higher proportion of sleep in REM (this is true in most species and supports the theory that REM sleep is involved in brain development). "
Source: http://emedicine.medscape.com/article/1 ... #aw2aab6b6
_________________
| Humidifier: S9™ Series H5i™ Heated Humidifier with Climate Control |
| Additional Comments: S9 Autoset machine; Ruby chinstrap under the mask straps; ResScan 5.6 |