StillAnotherGuest wrote: split_city wrote:Are you referring to this snapshot??
No, this one:

Well that's where the confusion lies as I was referring to the other snapshot when talking about the apnea .
StillAnotherGuest wrote: split_city wrote:The readings on the oximeter we have (in our research room anyway), only displays whole numbers. The actual data in our acquisition displays values up to two decimal places.
Yeah but the graph is only reporting out whole numbers so it ends up choppy like

instead of smooth like
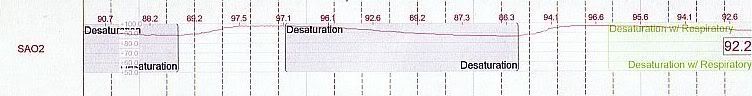
Further, the numbers are getting rounded off, so you're missing up to 0.4s here and there.
Yeah, the sats curves are much smoother in the diagnostic studies.
StillAnotherGuest wrote: split_city wrote:I have a question for you:
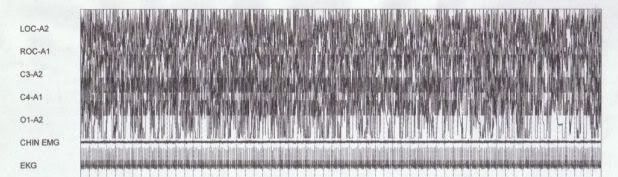
Just say the below "event" lasted >10secs and sats dropped by >3%, would it be called a hypopnea or apnea?
An apnea. The new rules say >90% reduction in thermal flow, without regard to any desaturations. However, use of 3% as a desat is an accepted alternative definition for hypopneas (4% is recommended).
Coll, thanks for that. When was this new rule introduced and who introduced it?
Now when you say at least 90% reduction, are you referring to the breaths prior to the event or "baseline" breaths i.e. at the beginning of the study when the subject was awake. I ask because flow can be quite high in patients who cycle through events very quickly (like the examples I have given). Patient arouses and hyperventilates, due to increased drive, falls alseep and has an apea within a few breaths. This flow is much higher compared to baseline breathing at the start of the study.
StillAnotherGuest wrote:split_city wrote:StillAnotherGuest wrote:A 53 cmH2O swing during "normal" breathing?
Just how beefy is this guy?
SAG
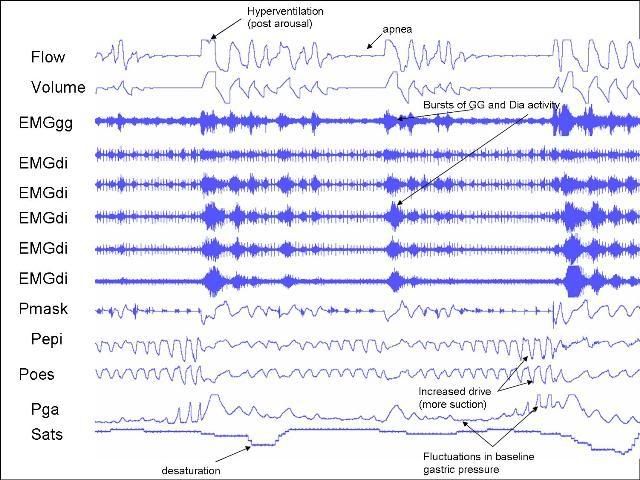
Yep, those values are correct. I wouldn't call it "normal" breathing as he was quite flow limited. His airway was acting like a Starling resistor. Drive was very much increased!
All my subjects are obese. His BMI was around 32
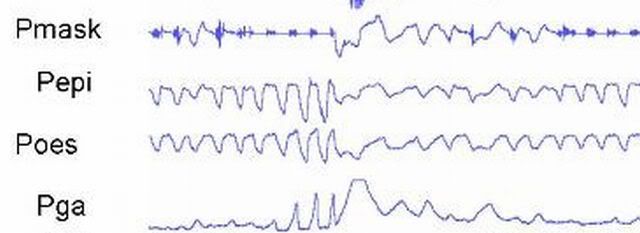
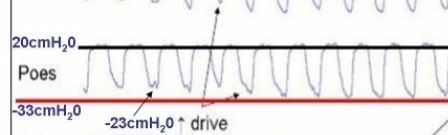
A question I have then regarding the "swing" is not the 33 cmH2O nadir but the 20 cmH2O positive inflection. Exhalation is passive, even in OSA, so baseline
Pes is normally 0 cmH2O. I imagine with massive forces on the airway, you could require large positive pressures for exhalation, but that wouldn't be obstructive apnea, that would be obstructed airway requiring tracheostomy. Asthma might show high
Pes on exhalation, but the expiratory limbs of the waveform are not prolonged. Or, are you doing the compressed abdomen thing.
Basline Pes e.g. at FRC is not normally 0cmH20 when the individual is either upright or supine. When upright, Pes at FRC is negative due to the elastic recoil of the lungs. However, it's generally positive when an individual is in the supine position because medialstinal structures compress the oesophagus, thus compressing the oesophageal balloon. Most of my baseline values have been between 5-10cmH20. Now, the 20cmH20 you are seeing is at peak expiration, not FRC. You would expect Pes to go up a bit during expiration due to the action of the respiratory muscles. However, as I said previously, drive was increased in this patient. This drive was transmitted to to abdominal muscles. These muscles are generally pretty silent during "normal" breathing. However, they tend to crank up during increased drive and contract during
expiration. You can tell this to be the case because gastric pressure was increasing during expiration (towards the end of the apneas) in my very first picture I put up. This increased contraction of the abdominal muscles during expiration also contributes to the raised expiratory Pes.
I do perform lung function tests on all my patients. This patient had a normal lung function.
_________________
CPAPopedia Keywords Contained In This Post (Click For Definition):
Hypopnea
_________________
CPAPopedia Keywords Contained In This Post (Click For Definition):
Hypopnea
_________________
CPAPopedia Keywords Contained In This Post (Click For Definition):
Hypopnea