Stu, In isolation your graphs don't tell us much. But certainly you seem to have hypopnea and apnea under control, based on the statistics.
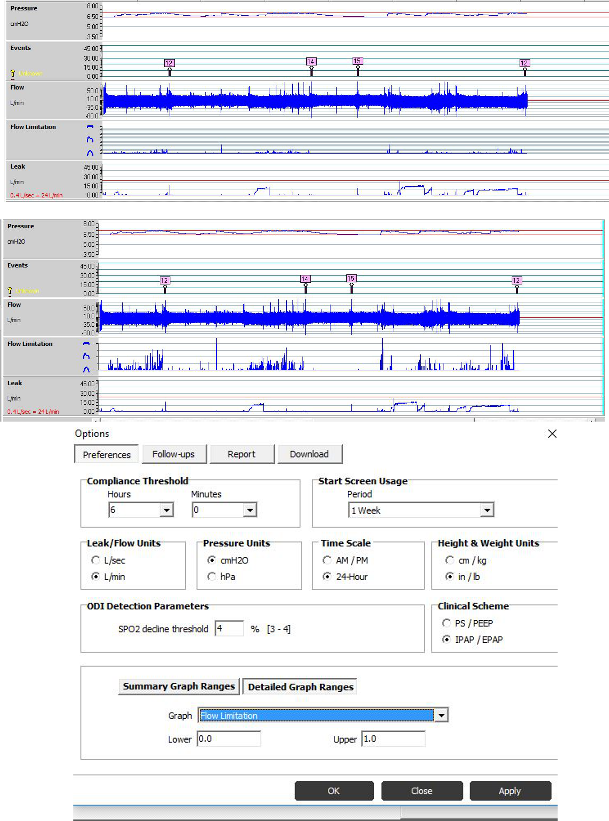
It would be better to show the Flow Limitations in relation to the other data as I have in the example below. Multiple graphs can be shown in the Navigation Window such as these, or close ups can be show in the Detailed Data window on the bottom. (These graphics could have been much larger, but I was in a hurry
Next we need to know the scale of the Flow Limitation Graph. Notice my Flow Limitations in the two examples below. They are the same graph but different scale. Unfortunately, the graphic doesn't readily indicate the scale.
To check and set the scale. Go to Tools>Options to get the dialogue box shown in my example. To put your Flow limitations in perspective make sure the "upper" is set at 1.0 for now, as it is for the top chart of my example.
StuUnderPressure wrote:I believe my Sleep Doctor and the related hospital that does the Sleep Studies is by far better than most out there.But, from my discussions with the Sleep Doctor, they know even less (MUCH LESS) than my elementary understanding of FLs & how to control them.
But at the lab, they may be able to determine your RDI which would include arousals (if any) from Flow LImitations, or RERAs. See the
AASM Manual Rules, sec 4.3.
Edit:
I believe each line of the Flow Limitation Graphic represents 0.05 regardless of scale. If so, I'm guessing your "upper" setting is around 0.5. I believe the default is 1.0. If it was changed from the default of 1.0 to 0.5, it would make your Flow Limitations "look" worse because of the scale and could account for a seeming change.
However, assuming the lines represent 0.05, you have many instances that far exceed that. It appears from my study that ResMed will raise the pressure of an auto machine when a Flow Limitation of 0.05 is encountered. From this, it would seem one would want to keep the "average" of Flow Limitations below 0.05. Keep in mind, this is just my conjecture based on my observance of how the machine responds. Aside from the mechanical means I mentioned above, the only way I know to lower the Flow Limitations would be through the application of additional pressure. This pressure may far exceed what would be needed to eliminate apneas and hypopneas. This is where a bi-level could be useful. At some point, additional EPAP could be disturbing to exhale against. A bi-level would allow higher IPAPs without raising EPAP so much through the use of Pressure Support (PS), essentially the difference between IPAP and EPAP. EPR is similar to PS, but it is limited to 3.0. With a bi-level, such as the Aircurve Vauto, that difference could be increased beyond the limitation of the 3.0 of the S9 auto and the Airsense 10.
After you check your setting, we will have an idea of your Flow Limitation magnitude. BTW, if you hold your cursor over a point of the Flow Limitation graphic, the value of the point will display as a pop up.
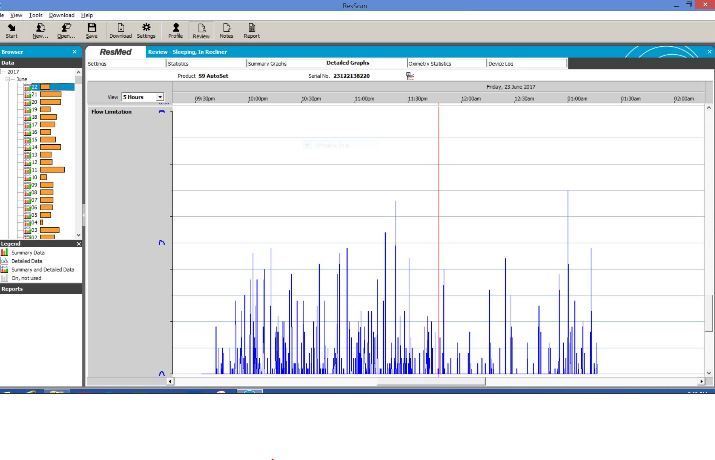
Your graphic showing 9:30 - 01:30: