Hi from new member (tried taping my mask)

General Discussion on any topic relating to CPAP and/or Sleep Apnea.
User avatar
leptic
Posts: 204
Joined: Wed May 18, 2016 9:33 pm
Location: Canada

Hi from new member (tried taping my mask)

Post by leptic » Wed May 18, 2016 10:24 pm

New member here. Please bear with my long backstory!

I’ve been struggling with EDS for much of my adult life, but over the last year the levels of sleepiness and cognitive fuzziness have got to the point where I’ve been barely functional at work. I was told there is around a six month wait list for an OSA test in our public health system, but found out that there are also private sleep clinics nearby. Last week I paid for a home test using a Philips Alice PDx system, and was told I might have to wait another ten days to have the results, and so am on standby for that.

I’m a 51 year old male, 6’2”/220lbs (this is too heavy for my frame) with asthma that is well controlled (might use my inhaler once every couple of months). I’ve never smoked but frequently have 1-2 glasses of wine with dinner. When in my 20s, I volunteered as a control subject in a research study that included an overnight sleep test followed by a daytime multiple sleep-latency test. There was no mention of sleep apnea, but the researcher who scored the tests later noted that my MSLT was indicative of narcolepsy. Because it was a research study, there was no followup (at the time, I didn’t really realize my EDS wasn’t normal). My doctor at the time prescribed stimulant medication for the EDS, which I have used intermittently over the last 30 years.

I had a back injury in 2013 and gained some weight due to reduced activity, which coincided with a dramatic increase in snoring that led me to being banished to the sofa for a couple of months. The snoring has been an ongoing issue for my long-suffering wife, and I’ve been sleeping on the sofa again for the last eight months or so. She has described the snoring as a combination of weird breathing, clicking, and wheezing. However, she has been adamant that I don't stop breathing and has kind of dismissed the apnea testing as a waste of time and money.

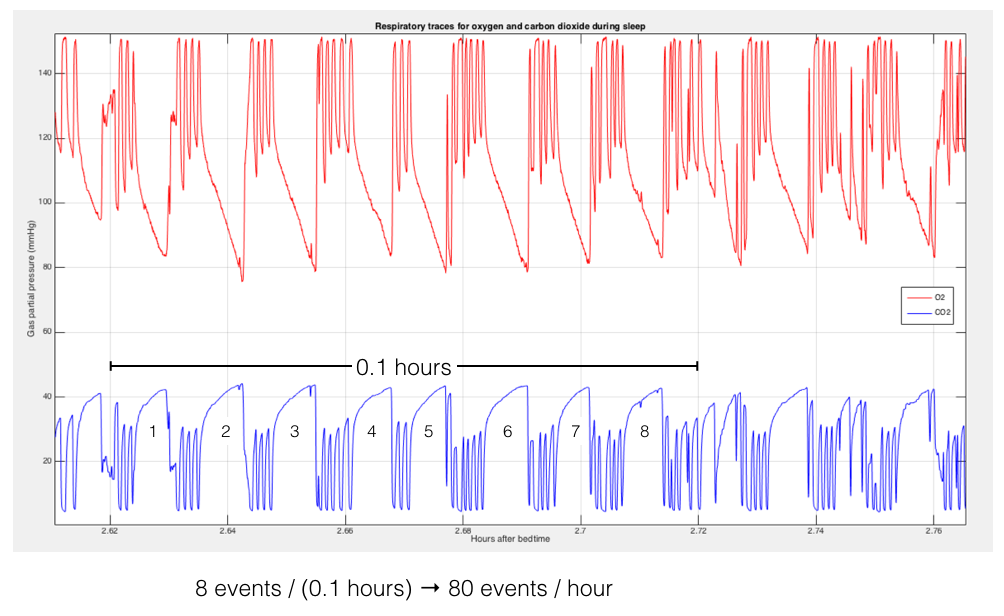
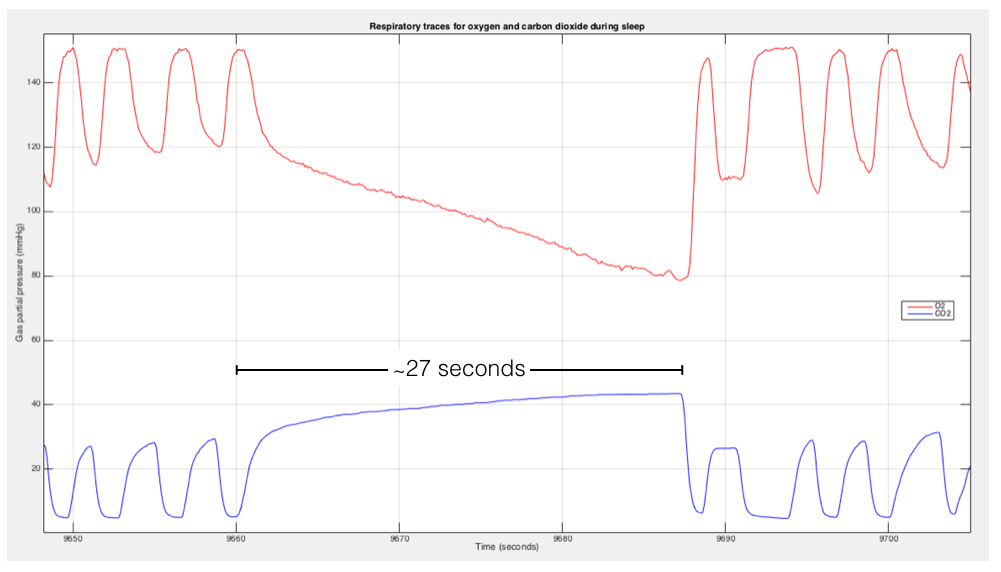
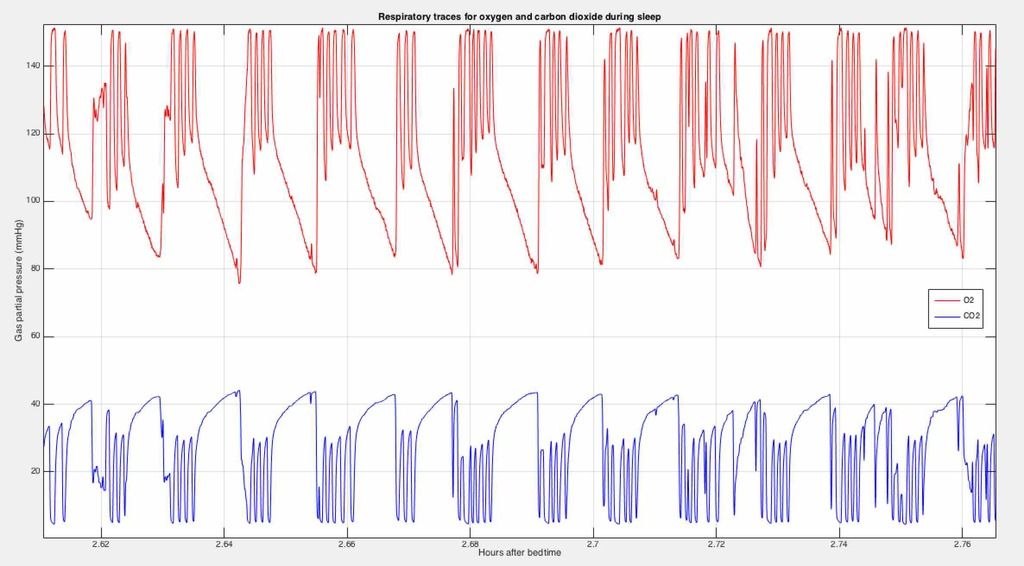
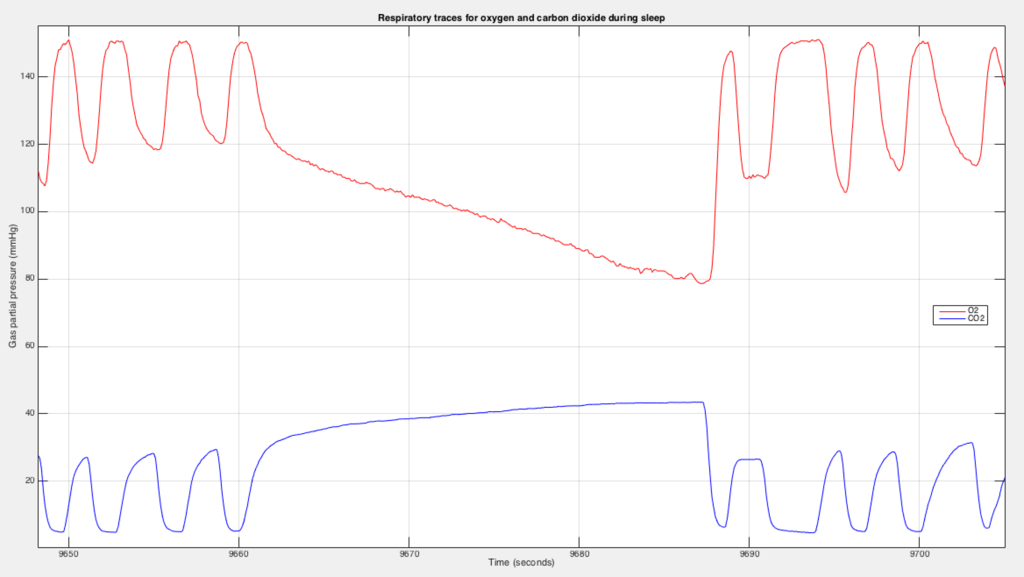
In an odd twist of fate, I actually work as a health science researcher in an area that involves a certain degree of respiratory physiology (I have a working knowledge but am not an expert, nor am I a physician). It happens that my group is building a system to record expired O2 and CO2 levels for a specific research application, so as part of the testing I decided to bring the prototype home and rig up a test circuit I could wear while sleeping (we do these measurements routinely in our work, although not usually during sleep). The traces I got last night are attached to this post - one image shows about ten minutes of recording and the other zooms in to show around a minute of data. I do not know much about sleep apnea, and while I wait for my ‘real’ doctor’s diagnosis (upon which any actual treatment will be based) I’d be interested in any comments on the signals I recorded.

The red trace is the instantaneous concentration of O2 flowing past a sampling port in a well-sealed face mask (there is an aperture to allow air in and out with negligible resistance; the sampling port takes air that is flowing through this at all times). The peaks represent inhaled room air, and the valleys represent the exhaled air from which some of the O2 has been absorbed in the lung. The blue trace shows the corresponding waveform for CO2 - in this case the peaks represent the exhaled CO2 (unloaded from the blood in the lung) and the valleys reflect the near-zero levels of CO2 in the atmosphere. In both cases, the 'end expiratory' values are considered a surrogate for the concentration of O2 and CO2 in the arterial blood exiting the lung.

I included segments that appear to show regular interruptions of breathing that happened in clusters lasting around an hour. During these clusters, the repetitive rate works out to around 80 ‘events’ per hour (which seems very high). However, these events happen in clusters and there are some periods of what appear to be more ’normal’ breathing (it would probably not be 80 events/hour averaged over the whole night). In the second image, the continued reduction in O2 level and buildup of CO2 are clearly visible during the period of apnea, which really gives the appearance of a very prolonged exhalation. The sampling port continually sucks a small amount of air (it’s driven by a noisy pump and I had to keep the analyzer outside of the basement room where I sleep), and the samples probably represent a mix of air pulled out of the mouth/throat/trachea and room air pulled in from outside (so the O2 depletion and CO2 buildup may actually be worse than depicted due to mixing with room air during apnea).

Image

Image

I was thus wondering: are the diagnostic criteria for AHI based on the total number of events in the whole night divided by the total hours of sleep, or the rate of events observed over shorter periods such as the clusters I’ve noted? Do the traces displayed here look like apneas? I have felt absolutely wretched on waking for many months, completely unrested and often with a headache and burning ache in my legs. I also seem to have at best around two hours per day when I’m really functional to any degree, the rest being spent in a kind of brain fog and just trying to stay awake. I had a doctor before just up the dosage of the Concerta I was taking, but I’ve realized that if I really have OSA then no amount of drugs will make up for the lack of quality sleep.

I will finish by stressing that I am going to base all treatment decisions on the advice of my physician. However, I am interested in both physiology and my health and would like to learn more as I wait for the official test result.

Thanks for reading this *long* first post! I am hoping that CPAP therapy will help manage this.
Last edited by leptic on Thu Jun 30, 2016 6:00 am, edited 4 times in total.

User avatar
palerider
Posts: 32299
Joined: Wed Dec 16, 2009 5:43 pm
Location: Dallas(ish).

Re: Hi from new member (waiting for test results)

Post by palerider » Wed May 18, 2016 10:43 pm

well, having never seen a chart like that, all I can ask is "what's it supposed to look like?"

for all I know, it's supposed to look like that.

_________________
Mask: Bleep DreamPort CPAP Mask Solution
Additional Comments: S9 VPAP Auto
Get OSCAR

Accounts to put on the foe list: dataq1, clownbell, gearchange, lynninnj, mper!?, DreamDiver, Geer1, almostadoctor, sleepgeek, ajack, stom, mogy, D.H., They often post misleading, timewasting stuff.

User avatar
leptic
Posts: 204
Joined: Wed May 18, 2016 9:33 pm
Location: Canada

Re: Hi from new member (waiting for test results)

Post by leptic » Wed May 18, 2016 11:01 pm

palerider wrote:well, having never seen a chart like that, all I can ask is "what's it supposed to look like?"

for all I know, it's supposed to look like that.
The wiggles should normally all have the same spacing.

User avatar
palerider
Posts: 32299
Joined: Wed Dec 16, 2009 5:43 pm
Location: Dallas(ish).

Re: Hi from new member (waiting for test results)

Post by palerider » Thu May 19, 2016 12:13 am

leptic wrote:
palerider wrote:well, having never seen a chart like that, all I can ask is "what's it supposed to look like?"

for all I know, it's supposed to look like that.
The wiggles should normally all have the same spacing.
so, what does the fact that it doesn't tell you?

_________________
Mask: Bleep DreamPort CPAP Mask Solution
Additional Comments: S9 VPAP Auto
Get OSCAR

Accounts to put on the foe list: dataq1, clownbell, gearchange, lynninnj, mper!?, DreamDiver, Geer1, almostadoctor, sleepgeek, ajack, stom, mogy, D.H., They often post misleading, timewasting stuff.

User avatar
Julie
Posts: 20020
Joined: Tue Feb 28, 2006 12:58 pm

Re: Hi from new member (waiting for test results)

Post by Julie » Thu May 19, 2016 3:02 am

Your premise is correct - total number of events per hour is what counts. May I suggest you look at the Wiki lightbulb (top of any pg) and start reading - there's a lot of info, and you'll likely have more questions afterward.

Are you in the UK or ?? It just helps to get some idea of e.g. available equipment that we may be aware of from other posters, your insurance (or lack of) system, etc.

User avatar
leptic
Posts: 204
Joined: Wed May 18, 2016 9:33 pm
Location: Canada

Re: Hi from new member (waiting for test results)

Post by leptic » Thu May 19, 2016 4:53 am

palerider wrote:
leptic wrote:
palerider wrote:well, having never seen a chart like that, all I can ask is "what's it supposed to look like?"

for all I know, it's supposed to look like that.
The wiggles should normally all have the same spacing.
so, what does the fact that it doesn't tell you?
Sorry - your question is good and I dashed off my terse response just before going to bed last night.

Basically, each peak in the blue trace and valley in the red trace represents a breath. So for example the first few peak/valley pairs to the left of the zoomed in plot represent three breaths over about ten seconds. Based on my experience working with this data in awake subjects, those breaths look 'normal' both in terms of their frequency and the concentrations of gases at end of expiration (if the blue CO2 curve is too high that's bad, and if the red O2 curve drops too low that's bad). After the three 'normal' breaths in the zoomed figure, there is a prolonged rise in the blue CO2 curve over a period of around 25 seconds. This is not normal in that it represents an abnormally long pause in breathing (without inspiration), the CO2 curve goes abnormally high (about 10mmHg above my normal level), and the O2 curve goes abnormally low (around 30mmHg below my normal level).

The other plot, showing a longer period of time, shows that these presumptive apneas occur very regularly (every 5-6 'normal' breaths) during a ten minute period. In the recordings I've made, these apnea clusters last an hour or more and probably include well over 30 events in those hours where they occur. However, not all hours during my sleep are like that.

I hope that clarifies, and thanks for reading my long post!

User avatar
leptic
Posts: 204
Joined: Wed May 18, 2016 9:33 pm
Location: Canada

Re: Hi from new member (waiting for test results)

Post by leptic » Thu May 19, 2016 4:55 am

Julie wrote:Your premise is correct - total number of events per hour is what counts. May I suggest you look at the Wiki lightbulb (top of any pg) and start reading - there's a lot of info, and you'll likely have more questions afterward.

Are you in the UK or ?? It just helps to get some idea of e.g. available equipment that we may be aware of from other posters, your insurance (or lack of) system, etc.
Thank you - will definitely check out the lightbulb pages.

Like you, I'm in Canada. I have provincial health care plus a fairly decent private insurance coverage from my employer.

User avatar
palerider
Posts: 32299
Joined: Wed Dec 16, 2009 5:43 pm
Location: Dallas(ish).

Re: Hi from new member (waiting for test results)

Post by palerider » Thu May 19, 2016 7:34 am

leptic wrote:Basically, each peak in the blue trace and valley in the red trace represents a breath. So for example the first few peak/valley pairs to the left of the zoomed in plot represent three breaths over about ten seconds. Based on my experience working with this data in awake subjects, those breaths look 'normal' both in terms of their frequency and the concentrations of gases at end of expiration (if the blue CO2 curve is too high that's bad, and if the red O2 curve drops too low that's bad). After the three 'normal' breaths in the zoomed figure, there is a prolonged rise in the blue CO2 curve over a period of around 25 seconds. This is not normal in that it represents an abnormally long pause in breathing (without inspiration), the CO2 curve goes abnormally high (about 10mmHg above my normal level), and the O2 curve goes abnormally low (around 30mmHg below my normal level).

The other plot, showing a longer period of time, shows that these presumptive apneas occur very regularly (every 5-6 'normal' breaths) during a ten minute period. In the recordings I've made, these apnea clusters last an hour or more and probably include well over 30 events in those hours where they occur. However, not all hours during my sleep are like that.

I hope that clarifies, and thanks for reading my long post!
well, it sounds like you've pretty much answered your own question about apnea...

whether you choose to go the classic route of getting a sleep study, an rx, and seeing if a doctor can guess the right treatment, or you pick up a machine on the secondary market and read your own data and treat yourself is pretty much up to you at this point ... depends on your insurance and finances, I suppose.

_________________
Mask: Bleep DreamPort CPAP Mask Solution
Additional Comments: S9 VPAP Auto
Get OSCAR

Accounts to put on the foe list: dataq1, clownbell, gearchange, lynninnj, mper!?, DreamDiver, Geer1, almostadoctor, sleepgeek, ajack, stom, mogy, D.H., They often post misleading, timewasting stuff.

User avatar
leptic
Posts: 204
Joined: Wed May 18, 2016 9:33 pm
Location: Canada

Re: Hi from new member (waiting for test results)

Post by leptic » Thu May 19, 2016 8:13 am

palerider wrote: well, it sounds like you've pretty much answered your own question about apnea...

whether you choose to go the classic route of getting a sleep study, an rx, and seeing if a doctor can guess the right treatment, or you pick up a machine on the secondary market and read your own data and treat yourself is pretty much up to you at this point ... depends on your insurance and finances, I suppose.
Thanks - I am trying to maintain a distinction between my own self-testing, which is for educational and academic purposes, and professional care by a licensed physician. Still, it's been hard not to be curious about what my status is and in the event that my 'real' test is inconclusive I'll probably push harder to make sure it's repeated until the results are clearly valid one way or the other.

Because of the expense I will definitely wait for the Rx and will check with my insurance company to see extent of coverage. There seems to be some great info on the Wiki about how to make sure the Rx is structured to provide the greatest choice of machines.
Last edited by leptic on Thu May 19, 2016 9:14 am, edited 1 time in total.

User avatar
palerider
Posts: 32299
Joined: Wed Dec 16, 2009 5:43 pm
Location: Dallas(ish).

Re: Hi from new member (waiting for test results)

Post by palerider » Thu May 19, 2016 8:17 am

leptic wrote: There seems to be some great info on the Wiki about how to make sure the Rx is structured to provide the greatest choice of machines.
most of that is US centric, though. there's a whole different set of rules at play in canadialand.

searching through the forum, or using google and site:cpaptalk.com in the query will get you plenty of info on how it works up there in the great frozen north (I'm kidding!).

_________________
Mask: Bleep DreamPort CPAP Mask Solution
Additional Comments: S9 VPAP Auto
Get OSCAR

Accounts to put on the foe list: dataq1, clownbell, gearchange, lynninnj, mper!?, DreamDiver, Geer1, almostadoctor, sleepgeek, ajack, stom, mogy, D.H., They often post misleading, timewasting stuff.

User avatar
DreamStalker
Posts: 7509
Joined: Mon Aug 07, 2006 9:58 am
Location: Nowhere & Everywhere At Once

Re: Hi from new member (waiting for test results)

Post by DreamStalker » Thu May 19, 2016 10:23 am

Based on those time scales, those traces can't possibly represent respiratory cycles. The upper chart represents less than 8 minutes of time while the lower represents less than 1 second. Is that correct?

So I don't see the 80 events per hour that you see.
President-pretender, J. Biden, said "the DNC has built the largest voter fraud organization in US history". Too bad they didn’t build the smartest voter fraud organization and got caught.

User avatar
leptic
Posts: 204
Joined: Wed May 18, 2016 9:33 pm
Location: Canada

Re: Hi from new member (waiting for test results)

Post by leptic » Thu May 19, 2016 10:52 am

DreamStalker wrote:Based on those time scales, those traces can't possibly represent respiratory cycles. The upper chart represents less than 8 minutes of time while the lower represents less than 1 second. Is that correct?

So I don't see the 80 events per hour that you see.
Sorry - the time axis is not very clear in these screen grabs. In the top figure, the time axis is in hours with decimal fractions. In the bottom, the time axis is seconds (i.e. the single 'apnea' starts at 9660 seconds). In both cases t=0 is when the recording was started immediately prior to going to bed. The 80 events/min figure is the *rate* during periods of regular apneas. I zoomed in on this part of the figure because longer time spans become illegible on the screen grabs. My earlier question was whether an AHI of 30 requires this average to be maintained over an entire eight hours of sleep (i.e. 240 events in total), or would 60 events over two hours also imply an AHI of 30 even if other hours had little or no apnea. Part of the reason I ask this is that the sleep lab where I did my ‘real’ test said they only need a couple of hours of recording. I wasn’t sure how this was possible if the AHI requires an average over the whole night.

Here are copies of the graphs with annotations to give a better idea. When I get back to the computer with the data, I’ll post a longer time span.

Image

Image

User avatar
DreamStalker
Posts: 7509
Joined: Mon Aug 07, 2006 9:58 am
Location: Nowhere & Everywhere At Once

Re: Hi from new member (waiting for test results)

Post by DreamStalker » Thu May 19, 2016 11:06 am

leptic wrote:
DreamStalker wrote:Based on those time scales, those traces can't possibly represent respiratory cycles. The upper chart represents less than 8 minutes of time while the lower represents less than 1 second. Is that correct?

So I don't see the 80 events per hour that you see.
Sorry - the time axis is not very clear in these screen grabs. In the top figure, the time axis is in hours with decimal fractions. In the bottom, the time axis is seconds (i.e. the single 'apnea' starts at 9660 seconds). In both cases t=0 is when the recording was started immediately prior to going to bed. The 80 events/min figure is the *rate* during periods of regular apneas. I zoomed in on this part of the figure because longer time spans become illegible on the screen grabs. My earlier question was whether an AHI of 30 requires this average to be maintained over an entire eight hours of sleep (i.e. 240 events in total), or would 60 events over two hours also imply an AHI of 30 even if other hours had little or no apnea. Part of the reason I ask this is that the sleep lab where I did my ‘real’ test said they only need a couple of hours of recording. I wasn’t sure how this was possible if the AHI requires an average over the whole night.
As I understand it, the AHI is indeed calculated for the entire night and NOT for just a small sample period (total number of events / total time of sleep). Having said that, an AHI of 80 is certainly possible ... I was diagnosed with AHI of 102 (101 apneas + 1 hypopnea).

However, your O2 desats have such a regular frequency that they don't appear to be simple obstructive apnea .... something else going on I think. It's been a real long time since I looked at my study report but I recall that my apneas had variable periods of O2 desats with some over a minute long -- while yours are very regular at about half a minute long.
President-pretender, J. Biden, said "the DNC has built the largest voter fraud organization in US history". Too bad they didn’t build the smartest voter fraud organization and got caught.

User avatar
DreamStalker
Posts: 7509
Joined: Mon Aug 07, 2006 9:58 am
Location: Nowhere & Everywhere At Once

Re: Hi from new member (waiting for test results)

Post by DreamStalker » Thu May 19, 2016 11:21 am

Here is a graph I found for converting your O2 partial pressure units to percent saturation ...

Image

Based on the fact that your correlated desats are at most around 90%, perhaps your events are all hypopneas ... restricted flows rather than apneas.

Maybe Pugsy or some other more knowledgeable member can comment on the regularly spaced O2 desats?
President-pretender, J. Biden, said "the DNC has built the largest voter fraud organization in US history". Too bad they didn’t build the smartest voter fraud organization and got caught.

User avatar
leptic
Posts: 204
Joined: Wed May 18, 2016 9:33 pm
Location: Canada

Re: Hi from new member (waiting for test results)

Post by leptic » Thu May 19, 2016 11:53 am

DreamStalker wrote:Here is a graph I found for converting your O2 partial pressure units to percent saturation ...

Based on the fact that your correlated desats are at most around 90%, perhaps your events are all hypopneas ... restricted flows rather than apneas.

Maybe Pugsy or some other more knowledgeable member can comment on the regularly spaced O2 desats?
Thanks! The minima in the O2 traces hover slightly above 80 mmHg, but this is probably an overestimate because in the absence of any real expiratory flow the sampling probe will suck in some room air as well (end-tidal sampling works well when you're sucking air in or out of the mask, past the sampling port). It’s hard to know what the real value is, but it’s probably well under 80 mmHg.

To read off these graphs, you also need to account for the elevation of CO2, which shifts the Hb-O2 affinity curve to the right (Bohr effect). This is where pulse oximetry would definitely be more informative as it’s a much better reflection of the real O2 content of the blood. The CO2 is actually quite important as well, as the high levels that build up have a number of detrimental effects. The CO2 dilates blood vessels in the brain, which causes an increase in intracranial pressure that probably accounts for the headaches that some people (myself included) report.

Here’s a curve that accounts for different CO2 levels, although I’d be careful to take this too literally as the real affinity depends on temperature and other variables. My CO2 looks like it only goes above 40, but that's also likely an underestimate because end-tidal values during an apnea are not really reliable.

Image

Thanks a lot for the discussion.