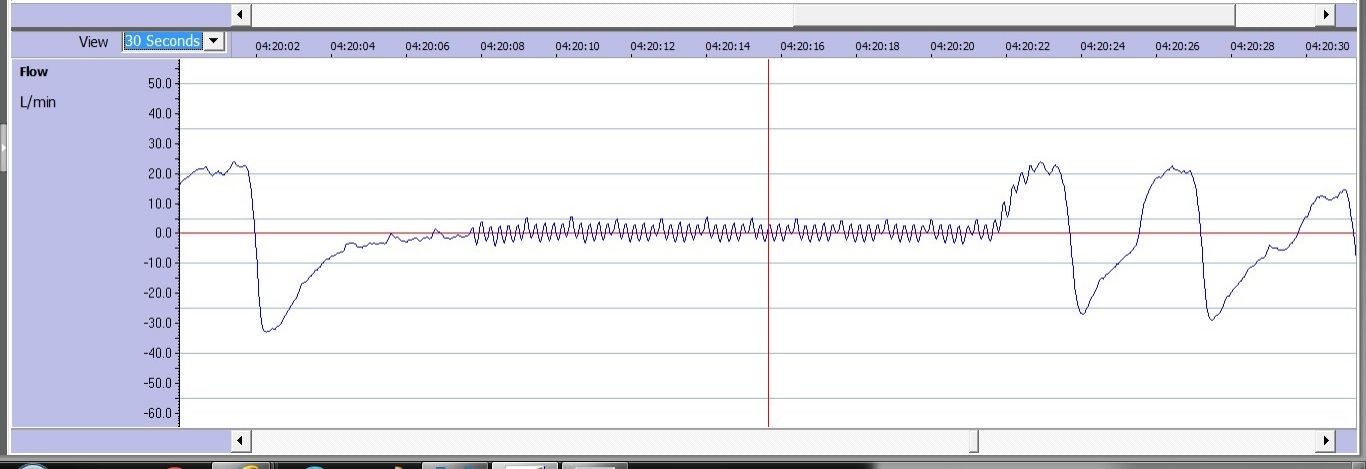
Comment,Setj wrote:That stumped me until I googled this explanation on this forum.Sludge wrote: That's "FOT".So is it safe to assume the sawtooth in my usual waveform is FOT?Forced Oscillation Technique. It's how the data capable S9s attempt to detect central apnea. It's a rapid series of small puffs of air. The machine measures the airflow changes to see if the air is reaching your lungs or not. (Simplified version)
I am beginning to think this therapy is about optimized for me and it is time to move on to other things. I would continue to check the display every morning. I would only do a data download if the numbers on the display looked bad or if I felt bad.
I have similar flow graph shapes as that of Setj:

But I can see the FOT, more clearly, in the graph during an event:

Same thing with Setj's graph. Those are all FOT oscillations. In Setj's flow- graph the vertical axis is scaled more precisely and because of it you can see the FOT's waves of 1 cm H2O, in amplitude, also enveloping the respirations waves. :


