Flow Limitation?

General Discussion on any topic relating to CPAP and/or Sleep Apnea.
User avatar
Setj
Posts: 123
Joined: Fri Dec 20, 2013 6:04 pm
Location: Rochester, NY

Flow Limitation?

Post by Setj » Fri Dec 20, 2013 6:31 pm

Hey, new user here with four nights of CPAP!

This has started out great!
Median daily usage 7:47 (100% compliance!)

AHI 2.1 (Great eh?)

Pressure
Median 12.7
95th 15.7
Max 17.1

Leak Median 12.7 (I had one bad three hour period in three nights that is throwing this high.)
Now for the question!!!

My "Flow Limitation" graphs for each of the four days look rough!

What is this? What does it mean? Why does the "Y" axis not have a scale? Should it have a scale? Should I be worried with a jagged chart with high peaks every night?

Thank you!
Seth

(I made a typo when I registered the user name. :oops: )

User avatar
Julie
Posts: 20051
Joined: Tue Feb 28, 2006 12:58 pm

Re: Flow Limitation?

Post by Julie » Fri Dec 20, 2013 6:34 pm

Did you have your sleep study in a lab or at home? If in a lab, has anyone (your MD) mentioned possible upper airway resistance syndrome (UARS)?

Ruinednose
Posts: 389
Joined: Wed Nov 13, 2013 2:16 pm
Location: Oklahoma

Re: Flow Limitation?

Post by Ruinednose » Fri Dec 20, 2013 6:48 pm

i have UARS or relly just maily hypopnea events

What are our FL graph like any Periodic breathing?

User avatar
Pugsy
Posts: 65121
Joined: Thu May 14, 2009 9:31 am
Location: Missouri, USA

Re: Flow Limitation?

Post by Pugsy » Sat Dec 21, 2013 1:15 pm

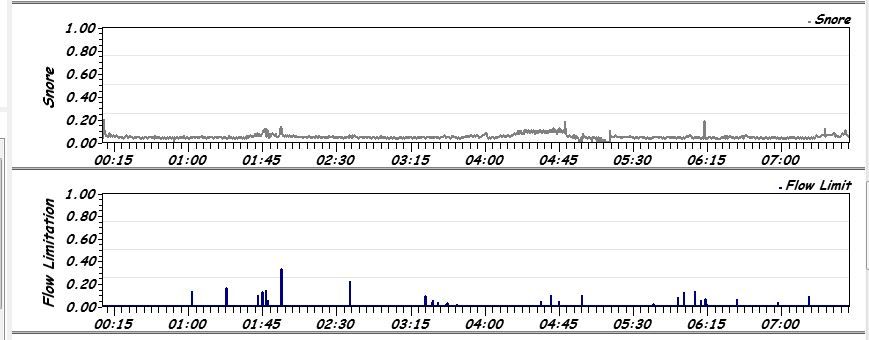
The S9 flow limitation graph is a bit difficult to evaluate as we are never really given much of a guide line to go by.
Generally.....the more activity you see....the greater the number of flow limitations and the higher the peaks the greater the actual reduction in flow is going to be.

My flow limitation graph is really boring and from what I have read....this is indicative of very effective therapy.
Compare yours to mine and you will see what I mean.

Don't know which software you are using...but the graphs are the same in either ResScan or SleepyHead.
This was probably one of my more active FL graphs which is still minimal and the most activity at about 90 minutes after sleep onset which is probably my first REM sleep and if I am going to have any events..REM is where I get them.
You may or may not see a pattern on your FL graph...usually if there are clusters of anything...it's either REM stage sleep or supine sleeping that isthe culprit.
To help reduce ugly flow limitations...a little more pressure...if using apap mode then a little more minimum pressure...if using cpap mode just a little more pressure.
Reducing EPR might also be an option if someone was comfortable with the reduction.

Image

_________________
Machine: AirCurve™ 10 VAuto BiLevel Machine with HumidAir™ Heated Humidifier
Additional Comments: Mask Bleep Eclipse https://bleepsleep.com/the-eclipse/
I may have to RISE but I refuse to SHINE.

Rick007
Posts: 50
Joined: Sun Oct 20, 2013 4:40 pm
Location: Ontario, Canada

Re: Flow Limitation?

Post by Rick007 » Sat Dec 21, 2013 2:11 pm

Setj wrote:Now for the question!!! My "Flow Limitation" graphs for each of the four days look rough!

What is this? What does it mean? Why does the "Y" axis not have a scale? Should it have a scale? Should I be worried with a jagged chart with high peaks every night?
I can't answer your question, but it is a good question. I asked it myself in an earlier post . If you want to compare my Flow Limitation graph to your own, have a look at that earlier post viewtopic.php?f=1&t=93747&p=865232&hilit=rescan#p865232. You can see how the graph is displayed in both SleepyHead and Rescan. I would be very interested in seeing your graph if you could post it.

I normally operate at 7.5 cmH2O and bumped it up to 8.5 cmH2O for a week. After using Excel to graph the FL values I saw no improvement. I am a little reluctant to try higher pressures without a doctors approval.

Pugsy posted an image in another thread which showed what the different breathing patterns look like.Here you can see what type of pattern is flagged as a Flow Limitation (hope Pugsy doesn't mind me using her stuff)

Image

User avatar
Setj
Posts: 123
Joined: Fri Dec 20, 2013 6:04 pm
Location: Rochester, NY

Re: Flow Limitation?

Post by Setj » Sun Dec 22, 2013 7:22 pm

Rick007 wrote: I would be very interested in seeing your graph if you could post it.

Yes Rick, here is a typical night (I have only used CPAP six nights. Started Monday night of this week.)

Image

For that night other things look great. 8 obstructive apneas all night - longest 20 seconds, leak mostly zero, snore very low, pressure - 12-20 setting, median 13.0, 95% 16.6, max 17.9.

I don't know what the flow limitation results mean but they don't look good at all.

Not sure what to do next. Pressure is already very high - would hate to raise it but the DME did show me how to get into the menu. But I still hate to raise it - painful gas in stomach at times.

Should I make a follow up appointment with the sleep doc and take this graph with me?

Wow, just six days and my head has information overload. A world I never imagined existed. Sheesh.
Seth

(I made a typo when I registered the user name. :oops: )

Rick007
Posts: 50
Joined: Sun Oct 20, 2013 4:40 pm
Location: Ontario, Canada

Re: Flow Limitation?

Post by Rick007 » Sun Dec 22, 2013 9:27 pm

Sorry I can't answer your questions. Like I said I have been trying to find the answer myself. Your graph is very similar to mine.

My first sleep study was 9 months ago (without CPAP) and it took 6 months to get the results. I was told I had an AHI=60 and was prescribed 7-14 cmH2o. The auto rental machine showed my 95% pressure to be 7.5 cmH2o, and I was sold a CPAP machine set at 7.5 cmH20. My AHI is almost always less than 1 at this setting.

I had my second sleep study at the hospital a few weeks ago. This time I was on PAP The sleep technician told me that I was doing pretty good, but that I would probably need a little boost from the setting I was using at home. I got a call from my DME a week later saying that they had received my new prescription of 7-9 (if I remember correctly) which was just a narrower range from my first sleep study . I asked the DME if I needed to have the pressure changed since I was already in that range and she said no, so I never went back for any changes.

To make a long story short, the fact that I am having flow limitations didn't seem to bother anyone during my second study. Since you have only been on CPAP for a few nights, you still need to get used to wearing the thing, and keeping your leaks to a minimum. As long as your AHI is under control I wouldn't worry about flow limitations for now. You can always bring that up during your second study.

User avatar
penuel
Posts: 83
Joined: Wed Dec 11, 2013 12:50 pm
Location: NC

Re: Flow Limitation?

Post by penuel » Tue Dec 31, 2013 5:31 pm

Setj wrote:
Rick007 wrote: I would be very interested in seeing your graph if you could post it.

Yes Rick, here is a typical night (I have only used CPAP six nights. Started Monday night of this week.)

Image

For that night other things look great. 8 obstructive apneas all night - longest 20 seconds, leak mostly zero, snore very low, pressure - 12-20 setting, median 13.0, 95% 16.6, max 17.9.

I don't know what the flow limitation results mean but they don't look good at all.

Not sure what to do next. Pressure is already very high - would hate to raise it but the DME did show me how to get into the menu. But I still hate to raise it - painful gas in stomach at times.

Should I make a follow up appointment with the sleep doc and take this graph with me?

Wow, just six days and my head has information overload. A world I never imagined existed. Sheesh.
Comment,

Setj, this is by Dr Steve Park:


Link: http://doctorstevenpark.com/tag/flow-limitation#


Sleep-disordered Breathing in Major Depressive Disorder


September 12, 2013

Symptoms of major depression and obstructive sleep apnea can overlap in many patients. The question that always arises is: Which comes first? Or are they two separate conditions that just happen to co-exist a lot? This interesting study looked 31 patients who had a formal depression diagnosis but were screened out for obstructive sleep apnea. Compared to healthy controls, these patients had significantly higher rates of flow limitation, which is a milder form of partial breathing obstruction that doesn’t qualify to be classified as an apnea or hypopnea. Flow limitation describes flattening of the nasal airflow tracings, which is associated with interrupted and poor quality sleep. Overall, patients with major depression were 5.86 times more likely to have a diagnosis of obstructive sleep apnea. Interestingly, all the patients that were screened out for significant obstructive sleep apnea also had a depression diagnosis.

What this paper suggests is that milder forms of sleep-related breathing disorders may contribute to symptoms of major depression. The study authors didn’t treat these patients with flow limitations, but sleep doctors will tell you that by normalizing these flow limitations, sleep quality can be significantly improved. Clinically, I see depression symptoms improve often after using CPAP or dental appliances, even if they don’t have obstructive sleep apnea but have narrowed upper airway passageways.


I doubt it that boosting pressures would normalize the FL.

_________________
Humidifier
Additional Comments: CareFusion chinstrap. Quite stiff and not smooth. Not for delicate faces.
How to get around ResScan 3.12: http://montfordhouse.com/cpap/resscan_tutorial/

teleute
Posts: 117
Joined: Thu Dec 05, 2013 12:32 am
Location: Calgary, AB, Canada

Re: Flow Limitation?

Post by teleute » Tue Dec 31, 2013 5:51 pm

Do we have any idea what "normalizing these flow limitations" would entail, numbers-wise? i.e. what a good goal number is? The FL's are definitely the highest number of events I'm seeing in my husband's data (2.81, compared to H=.27, O=.13 and CA=.27 for last night, as an example). I know those latter three numbers are quite good, but I haven't been able to get a handle on how the 2.81 is.

_________________
Humidifier: DreamStation Heated Humidifier
Additional Comments: Pressure 10.5-14

User avatar
Setj
Posts: 123
Joined: Fri Dec 20, 2013 6:04 pm
Location: Rochester, NY

Re: Flow Limitation?

Post by Setj » Tue Dec 31, 2013 6:06 pm

penuel wrote:
Setj wrote:
Rick007 wrote: I would be very interested in seeing your graph if you could post it.

Yes Rick, here is a typical night (I have only used CPAP six nights. Started Monday night of this week.)

Image

For that night other things look great. 8 obstructive apneas all night - longest 20 seconds, leak mostly zero, snore very low, pressure - 12-20 setting, median 13.0, 95% 16.6, max 17.9.

I don't know what the flow limitation results mean but they don't look good at all.

Not sure what to do next. Pressure is already very high - would hate to raise it but the DME did show me how to get into the menu. But I still hate to raise it - painful gas in stomach at times.

Should I make a follow up appointment with the sleep doc and take this graph with me?

Wow, just six days and my head has information overload. A world I never imagined existed. Sheesh.
Comment,

Setj, this is by Dr Steve Park:


Link: http://doctorstevenpark.com/tag/flow-limitation#


Sleep-disordered Breathing in Major Depressive Disorder


September 12, 2013

Symptoms of major depression and obstructive sleep apnea can overlap in many patients. The question that always arises is: Which comes first? Or are they two separate conditions that just happen to co-exist a lot? This interesting study looked 31 patients who had a formal depression diagnosis but were screened out for obstructive sleep apnea. Compared to healthy controls, these patients had significantly higher rates of flow limitation, which is a milder form of partial breathing obstruction that doesn’t qualify to be classified as an apnea or hypopnea. Flow limitation describes flattening of the nasal airflow tracings, which is associated with interrupted and poor quality sleep. Overall, patients with major depression were 5.86 times more likely to have a diagnosis of obstructive sleep apnea. Interestingly, all the patients that were screened out for significant obstructive sleep apnea also had a depression diagnosis.

What this paper suggests is that milder forms of sleep-related breathing disorders may contribute to symptoms of major depression. The study authors didn’t treat these patients with flow limitations, but sleep doctors will tell you that by normalizing these flow limitations, sleep quality can be significantly improved. Clinically, I see depression symptoms improve often after using CPAP or dental appliances, even if they don’t have obstructive sleep apnea but have narrowed upper airway passageways.


I doubt it that boosting pressures would normalize the FL.

Thank you Penuel for the reference. What that doctor is saying makes sense to me.
Last edited by Setj on Mon Feb 10, 2014 7:57 pm, edited 1 time in total.
Seth

(I made a typo when I registered the user name. :oops: )

User avatar
Setj
Posts: 123
Joined: Fri Dec 20, 2013 6:04 pm
Location: Rochester, NY

Re: Flow Limitation?

Post by Setj » Tue Dec 31, 2013 6:10 pm

teleute wrote:Do we have any idea what "normalizing these flow limitations" would entail, numbers-wise? i.e. what a good goal number is? The FL's are definitely the highest number of events I'm seeing in my husband's data (2.81, compared to H=.27, O=.13 and CA=.27 for last night, as an example). I know those latter three numbers are quite good, but I haven't been able to get a handle on how the 2.81 is.

I think you asked the key question.

So your setup gives you a count of FLs? I am using a ResMed machine and ResScan software and can only find the graph of FLs that I posted above. Nowhere do I see a count?

Maybe I should load SleepyHead to get a better idea about FLs?

BTW, I continue to feel good about my CPAP process and my energy level in the day is up a great deal.

Happy New Year to all you fine people!
Seth

(I made a typo when I registered the user name. :oops: )

teleute
Posts: 117
Joined: Thu Dec 05, 2013 12:32 am
Location: Calgary, AB, Canada

Re: Flow Limitation?

Post by teleute » Tue Dec 31, 2013 6:22 pm

I'm seeing the count in SleepyHead, yes.

_________________
Humidifier: DreamStation Heated Humidifier
Additional Comments: Pressure 10.5-14

User avatar
penuel
Posts: 83
Joined: Wed Dec 11, 2013 12:50 pm
Location: NC

Re: Flow Limitation?

Post by penuel » Tue Dec 31, 2013 6:51 pm

If Dr Steve Park is correct then those affected might reduce the FL by taking medications such as Xanax. I need to try it out myself. I been taking a small dose of Alprazolam (generic Xenex) 0.5 mg for about a year now. But I don't see my FL falling yet:

From a few days ago:

Image

Image


I tried to raise the pressures in my S9 APAP by 1 cm each, and also lower the EPR from 3 to 2 and later to 1, but it made it worse. See here:

after lowering EPR from 3 to 1 and no change on pressures:

FL became worse

The Stats for the following FL graph

Image


Image

Respiration waves curves are flat on their tops and not rounded:

Image

FL level measurement:

Image

_________________
Humidifier
Additional Comments: CareFusion chinstrap. Quite stiff and not smooth. Not for delicate faces.
Last edited by penuel on Wed Jan 01, 2014 2:16 pm, edited 2 times in total.

User avatar
robysue
Posts: 7520
Joined: Sat Sep 18, 2010 2:30 pm
Location: Buffalo, NY
Contact:

Re: Flow Limitation?

Post by robysue » Tue Dec 31, 2013 10:23 pm

Setj wrote: I think you asked the key question.

So your setup gives you a count of FLs? I am using a ResMed machine and ResScan software and can only find the graph of FLs that I posted above. Nowhere do I see a count?

Maybe I should load SleepyHead to get a better idea about FLs?
Resmed S9s shows the flow limitation data as a continuous graph with respect to time. PR System Ones show the flow limitation data as discrete events (tick marks) that you can count.

There's not an official "right" way to display or report flow limitation data.

Things to consider:

On the Resmed S9 you don't get a "count" of the number of flow limitations and you can't compute a flow limitation index. But you do have a graph that shows you how severe the flow limitations are and how long flow limitation breathing lasts.

On the PR System One, you get an easy to understand count of the Flow Limitations---if you are running an APAP or a BiPAP Auto in AUTO mode. (If you are using a PR machine in fixed pressure mode, it will NOT record the flow limitation flags.) So you can compute an index in the same way that the AHI is computed. But PR never defines what the criteria are for scoring a flow limitation and there is no way to quickly measure how bad any particular flagged FL event actually is. You can get some sense of how long flow limited breathing lasts by looking for series of FL tick marks, but that's not as straightforward as the FL graph in ResScan.

Having used both machines, I actually prefer the Resmed way of handling flow limitation and snoring data. Since these are things that can go on for minutes at a time, it makes some sense to display the data as a graph with respect to time rather than tick marks. The graph can give you both the "how bad is it?" information and "how long did it last?" information. "How bad is it?" is answered by looking at how high up the vertical bumps go in the graph. "How long did it last?" is answered by looking at the horizontal length of the episodes of flow limited breathing or snoring.

_________________
Machine: DreamStation BiPAP® Auto Machine
Mask: Swift™ FX Nasal Pillow CPAP Mask with Headgear
Additional Comments: PR System DreamStation and Humidifier. Max IPAP = 9, Min EPAP=4, Rise time setting = 3, minPS = 3, maxPS=5

User avatar
penuel
Posts: 83
Joined: Wed Dec 11, 2013 12:50 pm
Location: NC

Re: Flow Limitation?

Post by penuel » Wed Jan 01, 2014 7:12 am

robysue wrote:
Setj wrote: I think you asked the key question.

Things to consider:

Having used both machines, I actually prefer the Resmed way of handling flow limitation and snoring data. Since these are things that can go on for minutes at a time, it makes some sense to display the data as a graph with respect to time rather than tick marks. The graph can give you both the "how bad is it?" information and "how long did it last?" information. "How bad is it?" is answered by looking at how high up the vertical bumps go in the graph. "How long did it last?" is answered by looking at the horizontal length of the episodes of flow limited breathing or snoring.
Comment,

This thread originated in Dec 20, we are now at the discussion stage as to how to reduce the Flow Limitation.

After I raised the min and max pressures on my S9 APAP by 1 cm each, there is some improvement in the FL, but not enough (EPR = 3):
Image

The Stats were:

Image

_________________
Humidifier
Additional Comments: CareFusion chinstrap. Quite stiff and not smooth. Not for delicate faces.
How to get around ResScan 3.12: http://montfordhouse.com/cpap/resscan_tutorial/