


In a number of threads, folks have posed questions regarding the MyEncore graph labeled “Dependence of Apnea/Hypopnea Indices (AHI) on Pressure.”
More specifically, the questions generally note an increase in apneas as pressure increases.
Many seem to be reversing the cause and effect relationship between these two numbers, i.e., they are interpreting the graph to mean that higher pressures ---> more apneas.
It seems to me that the relationship is just the other way around; that an increase in the propensity for apneas (say, because I roll over to my back while asleep) causes the machine to increase the pressure as a response. Isn’t that what the machine is programmed to do? More apneas ---> higher pressure.
It seems to me that comparing Pressure vs. AHI is useful only if the APAP were being used in CPAP mode, i.e., set it to hold a fixed pressure and see what AHI results.
My 2 cents worth.
Wayne
Dependence of Apnea/Hypopnea Indices (AHI) on Pressure


3 posts
• Page 1 of 1
Dependence of Apnea/Hypopnea Indices (AHI) on Pressure
_________________
| Mask: Ultra Mirage™ Full Face CPAP Mask with Headgear |
| Additional Comments: APAP w/CFlex @ 10 cm to 14 cm |
-
NightHawkeye
- Posts: 2431
- Joined: Thu Dec 29, 2005 11:55 am
- Location: Iowa - The Hawkeye State
I agree.
The only way to find out if increased pressure causes more apneas is to setup the automatic as a straight CPAP machine, and record the data. Once the pressure is stable, you can start analysing the causal realationship.
This is how Derek handled the issue - and I believe anyone with Encore Pro and My Encore (Derek's creation) will benefit from doing it like that.
O.
_________________
CPAPopedia Keywords Contained In This Post (Click For Definition): cpap machine, Encore Pro, AHI, auto, APAP
The only way to find out if increased pressure causes more apneas is to setup the automatic as a straight CPAP machine, and record the data. Once the pressure is stable, you can start analysing the causal realationship.
This is how Derek handled the issue - and I believe anyone with Encore Pro and My Encore (Derek's creation) will benefit from doing it like that.
I wish I had a My Encore equivalent for the SilverLining....derek wrote:For the past three weeks I've been doing an experiment, comparing my nightly data using CPAP wiith that from the previous three months on APAP (REMSTAR Auto with C-Flex). Although the "experiment" is still a work-in-progress, I am convinced that I get significantly better therapy from CPAP. Here's the scoop:
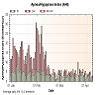
As most of you know, I have been plotting my data using MyEncore, and I have frequently shown the following graph showing how my AHI depends on pressure:
This curve is based on 700 hours of APAP, with the minimum pressure set between 7 and 9 cm H2O. Now the shape of this curve has always bothered me for a couple of reasons: 1) The whole basis for the APAP algorithms is that the AHI should decrease with pressure. I was concerned that if I ended up on the positive slope above 10cm, if I had some event (snore?) that raised the pressure, then I was in fact in a worse position, and would be even more likely to have another event. In other words, on the positive slope we have a positive-feedback situation which can only make things worse, and even lead to pressure runaway - which I have found a few times. 2) I wondered if this curve really represented me, and was not an artifact of the APAP pressure control algorithm.
So I decided to do a study on myself using the CPAP mode. I decided to concentrate on the central region and have been buiding up AHI performance data for pressures of 9, 10, and 11 cm. Each night I have my wife choose one of the three pressures at random, and I looks at the total results in the morning. Here is the CPAP pressure-AHI plot for three weeks worth of data:
Now compare this to the same pressure range extracted from the first chart (ie 3 months of APAP data).
The plots are almost identical indicating that, at least in this data range, the APAP AHI-pressure plot provides a good picture of my true AHI-pressure dependence.
Now here's the thing: my nightly AHI's are significantly lower on the CPAP at any of the three pressures than on APAP at 9 - 14 cm, (I know that they are already low. ) and what's more the night to night variation in AHI is much, much reduced. I don't have the statistics yet, but looking at my nightly plots it is obvious that there is much less variation. I put this down to the fact that the nightly meanderings of the APAP pressure actually are inducing apneas/hypopneas.
So here's the question. If anybody has a concave AHI-pressure plot like mine, why would they ever want to set the maximum APAP pressure above the minimum in the plot (10 cm in my case)? You are, by definition, not going to get any better treatment from higher pressures. And if you can tolerate the 10 cm pressure, why bother with the lower pressures?
Why not just set up in CPAP mode at the pressure with the lowest AHI? I'm going to stay in CPAP.
derek


O.
_________________
CPAPopedia Keywords Contained In This Post (Click For Definition): cpap machine, Encore Pro, AHI, auto, APAP
_________________
| Mask: AirFit™ P10 Nasal Pillow CPAP Mask with Headgear |
| Additional Comments: Machine: Resmed AirSense10 for Her with Climateline heated hose ; alternating masks. |
3 posts
• Page 1 of 1