


- Cable to interface from Computer to Nellcor N-395: - DONE
- Create a Simple COMM Program to capture Nellcor data: - DONE
- Create a simple utility to parse Nellcor data into Excel: - DONE
- Create code to interface with Encore PRO MS SQL Server: - DONE
Here are the stored fields:
Code: Select all
DATE - TIME %SPO2 BPM PA Status Once the data is saved as a text file it can be read with any text-reading program like Window’s NotePad.
Data saved in the file will look something like this:
Code: Select all
N-395    VERSION 1.9.0.2     TREND  SpO2 Limit: 85-100%    PR Limit: 40-170BPM
                             ADULT          0SECS
TIME                 %SPO2   BPM     PA
24-JAN-06 07:05:19    94      89     176
24-JAN-06 07:05:23    94      88     200
24-JAN-06 07:05:27    93      88     188
24-JAN-06 07:05:31    93      89      54
24-JAN-06 07:05:35    93      90      34
24-JAN-06 07:05:39    93      87      36
24-JAN-06 07:05:43    93      89      36
24-JAN-06 07:05:47    93      91      32
24-JAN-06 07:05:51    93      92      36
24-JAN-06 07:05:55    93      92      36
…
[SNIP]

or it will look like this if the Pulse Probe is not connected:
N-395    VERSION 1.9.0.2    CRC:2DF7  SpO2 Limit: 80-100%    PR Limit: 40-170BPM
                             ADULT            0SECS
TIME                 %SPO2   BPM     PA     Status
03-MAY-06 11:22:22   ---     ---     ---    SO
03-MAY-06 11:22:24   ---     ---     ---    SO
03-MAY-06 11:22:26   ---     ---     ---    SO
03-MAY-06 11:22:28   ---     ---     ---    SO
03-MAY-06 11:22:30   ---     ---     ---    SO
…
[SNIP]
Code: Select all
24-JAN-06,07:05:19,94,89,176,85,40,170
24-JAN-06,07:05:23,94,88,200,85,40,170
24-JAN-06,07:05:27,93,88,188,85,40,170
24-JAN-06,07:05:31,93,89,54,85,40,170
24-JAN-06,07:05:35,93,90,34,85,40,170
24-JAN-06,07:05:39,93,87,36,85,40,170
24-JAN-06,07:05:43,93,89,36,85,40,170
24-JAN-06,07:05:47,93,91,32,85,40,170
24-JAN-06,07:05:51,93,92,36,85,40,170
24-JAN-06,07:05:55,93,92,36,85,40,170
…
[SNIP]
What Next:
Right now my software is just a simple collection of utilities that use hard coded file paths. That will change as I finish work on a charting module that I can use to create graphs to view the data without EXCEL.
Unfortunately, this next phase of the project will take longer than doing the things that achieved this progress. It will take longer because I’ll need to roll my own graphing code if I hope to be able to stack chart data displays and use a mouse cursor to highlight and display connected time data. It will also be important to have an open code module when it is time to display Encore Pro’s event data in additional time connected graphs. Hopefully, by understanding what is happening with the OSA and how that is affecting the SPO2% and BPM, I’ll begin to get a better understanding of how the titration is helping, where it might need to be improved and how mask leaks are impacting the quality of my treatment.
So far none of this work has been hard or taken much time, but it is tedious work that only gets attention when life isn’t getting in the way. Still, it has been interesting and hopefully it will continue to be informative as more information is collected.
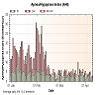
To see what a night of Nellcor data looks like in EXCEL, click on this link: Excel SPO2%-BPM Charts

