sleepyhead graph results (good or bad?)

General Discussion on any topic relating to CPAP and/or Sleep Apnea.
allennosleep
Posts: 25
Joined: Tue Nov 08, 2011 10:54 pm

sleepyhead graph results (good or bad?)

Post by allennosleep » Wed Nov 09, 2011 6:06 pm

I installed sleepyhead and read out the data from my respironics system one machine. I've been using the cpap for 1.5 months now and it's another 1.5 months till my next appointment with the sleep doctor. I'm getting some relief but not as much as I would like so I'm wondering if these results are good bad horrible or average. Anything notable?

Nov 6
Image

Nov 7
Image

User avatar
Pugsy
Posts: 65119
Joined: Thu May 14, 2009 9:31 am
Location: Missouri, USA

Re: sleepyhead graph results (good or bad?)

Post by Pugsy » Wed Nov 09, 2011 7:35 pm

Leak line is great.

What were the AHI numbers and their breakdown for these 2 nights? You know.... AHI...CA ..OA...Hyponea indexes from the little colored graph. The hourly averages?

Do you have frequent awakenings during the night? I see one break in the therapy line. Do you have other times where you wake often? Trouble going back to sleep?

Do you have a copy of your sleep studies? If so, any mention of centrals?

First half of the night you do superb but something happens during the second half? Any idea what?

_________________
Machine: AirCurve™ 10 VAuto BiLevel Machine with HumidAir™ Heated Humidifier
Additional Comments: Mask Bleep Eclipse https://bleepsleep.com/the-eclipse/
I may have to RISE but I refuse to SHINE.

User avatar
robysue
Posts: 7520
Joined: Sat Sep 18, 2010 2:30 pm
Location: Buffalo, NY
Contact:

Re: sleepyhead graph results (good or bad?)

Post by robysue » Wed Nov 09, 2011 9:14 pm

Picking up on Pugsy's comments: The number of OAs and Hs seems to be reasonable---the combined OAI + HI appears to be below 2, maybe even 1.5. But by my quick count, there's about 30 CA's between 3:30 and 7:30 on the first night of data; since mask time is about 7 hours the CAI in SH is probably around 4.0. And there are over 55 CA's in the second night of data in about 7.5 hours of sleep for an estimated CAI of about 7.3. So the obstructive events seem to be well treated by the machine, but the machine is scoring a whole lot of centrals. The question then becomes, Are those machine scored centrals real centrals? Which is why pugsy's question about whether your sleep study---particularly the titration study----said anything about centrals. It's also why pugsy has asked the pertinant question of whether you're waking up a lot and having trouble getting back to sleep: Some centrals are common place when we are first drifting off to sleep and they are not necessarily scored as SDB events on a full PSG study. Likewise our wakeful breathing patterns are more irregular than our sleep breathing patterns, and it's not uncommon for us to momentarily hold our breath while we are awake, and this kind of thing would not be scored as SDB on a full PSG study. But your CPAP can't tell a real central from these "false centrals" and it flags all of them as centrals.

But in my opinion, if you're seeing this kind numbers in CA's night after night after night, AND you're not yet feeling any better or you're feeling worse than before you started CPAP, it may be appropriate to see if you can move that doctor's appointment up sooner or get on a cancellation list.

Other things to mention: There are a few bumps in the leak lines, but for the most part the leak line are pretty flat. Unless you are waking up because of a leak or waking up with a super dry mouth or puffy eyes from a leak blowing in them, I don't think you need be worried about leaks if these leak lines are pretty typical for you. And the spikes in the Snore graphs are short lived, so the machine is not detecting much snoring going on, which is also good. Finally, are you running in APAP mode or CPAP mode? It looks like you are running in APAP mode because of the pressure "test patterns" where it looks like the S1 is using its periodic hunt and peck method of testing whether the pressure should be increased to improve the shape of the flow wave. But it hardly ever decides to increase pressure. So if you are running in APAP mode with a minimum pressure of 10cm, the machine is happy enough with the quality of your flow wave at that pressure. Note: The machine intentionally does not increase pressure in response to clusters of central apneas.

_________________
Machine: DreamStation BiPAP® Auto Machine
Mask: Swift™ FX Nasal Pillow CPAP Mask with Headgear
Additional Comments: PR System DreamStation and Humidifier. Max IPAP = 9, Min EPAP=4, Rise time setting = 3, minPS = 3, maxPS=5

User avatar
Pugsy
Posts: 65119
Joined: Thu May 14, 2009 9:31 am
Location: Missouri, USA

Re: sleepyhead graph results (good or bad?)

Post by Pugsy » Wed Nov 09, 2011 9:53 pm

I went back and looked at your other thread and I saw the mention of AHI 7 or so. Obviously the bulk of that AHI is CA.

Robysue has explained why I was concerned. Usually when someone has a predominance of the Clear Airway events it is normally spread out over the entire night. Yours is almost half and half both nights. A few Clear Airway events are normal. This is a little more than normal during the second half of the night but there could be a logical explanation for these reports. First half of the night is normal looking.

Do you take any meds?

_________________
Machine: AirCurve™ 10 VAuto BiLevel Machine with HumidAir™ Heated Humidifier
Additional Comments: Mask Bleep Eclipse https://bleepsleep.com/the-eclipse/
Last edited by Pugsy on Wed Nov 09, 2011 10:36 pm, edited 1 time in total.
I may have to RISE but I refuse to SHINE.

User avatar
JointPain
Posts: 261
Joined: Thu Apr 28, 2011 10:41 am
Location: Houston, TX

Re: sleepyhead graph results (good or bad?)

Post by JointPain » Wed Nov 09, 2011 10:32 pm

The Sleepyhead graphs don't show the duration of the CAs. Can you look that up and let us know how long they are on average? In Sleepyhead you can get that by clicking on the Events tab on the left column in the Daily view, and then expanding the Clear Airway Apnea heading.

_________________
Mask: Swift™ FX Nasal Pillow CPAP Mask with Headgear
Humidifier: S9™ Series H5i™ Heated Humidifier with Climate Control
Additional Comments: Pressure is 11-14. Old CPAP was a Resmed S6 Lightweight. Also have Profile lite mask. ResScan is actually version 3.14. Now I use Sleepyhead.

Guest

Re: sleepyhead graph results (good or bad?)

Post by Guest » Thu Nov 10, 2011 12:24 am

I really appreciate the info. I will try to answer all questions best I can.

I am not waking up in the night hardly at all that I can remember. The one on nov6 was me getting up to hit the restroom. Otherwise I am not experiencing lots of waking up events.

I wish I knew why the second half of the night always appears much worse than the first. I simply don't have an explanation for it. Any suggestions on what it might be? Looking through the rest of my graphs this is a very consistent pattern.

I do not take any medications for anything.

The Clear Airway Apnea events are all from 8 to 13 seconds according to the events->Clear Airway Apnea (29 events) for nov 6. Looking at the graph magnified up it appears the entire event from when I take a shallow breath to when it smooths out appears to be about 45 seconds end to end.

The machine is set to 'aflex'. I honestly don't know if thats cpap or apap. I'm still learning all of this.

I don't know if my original studies (both of them) showed lots of central apneas. I just checked wikipedia on central apneas and these look like what it describes. I take a short or non existant breath, a huge breath next then it starts to even back out. When I magnify them in sleepyhead they are all the same.

On the cpap vs apap. I guess I need to learn more about what that is. I was surprised at how little bump up in pressure I seem to be getting.

On the second night, I had quite a few nightmares (I have no idea if that matters here but I thought I'd mention it). I'll take them though as before I started using the machine I hadn't dreamed or nightmared in a very long time.

One last note, I am moving my min pressure from 10 to 11 tonight to see if that smooths things out some.

User avatar
Pugsy
Posts: 65119
Joined: Thu May 14, 2009 9:31 am
Location: Missouri, USA

Re: sleepyhead graph results (good or bad?)

Post by Pugsy » Thu Nov 10, 2011 12:56 am

I don't think an increase in minimum pressure is the way to go. The cpap pressure is used to help maintain or hold the airway open and thus is used for obstructive events because obstructive means the airway tissues collapse either full collapse (OA) or partial collapse (Hyponea)and thus the term obstructive. Your obstructive events (OA and Hyponeas) are already well treated.

Clear airway (centrals) are a cessation of air flow but the airway is not obstructed. There is no collapse of the airway tissues. Instead the airway is completely open but no air moves.
Hold your breath for 10 seconds. That is technically a clear airway cessation of breathing or a central.

There are a small percentage of cpap users who pressure actually will trigger more centrals. 10 to 15 % of cpap users may have this happen. It is not common but it can happen. Your "centrals" (if they are real centrals) don't appear in the first half of the night..this would be odd because if one is going to have these pressure induced centrals then logic tell us they would happen all night, not just half the night. But something to consider.

If anything...I would think about reducing the minimum.

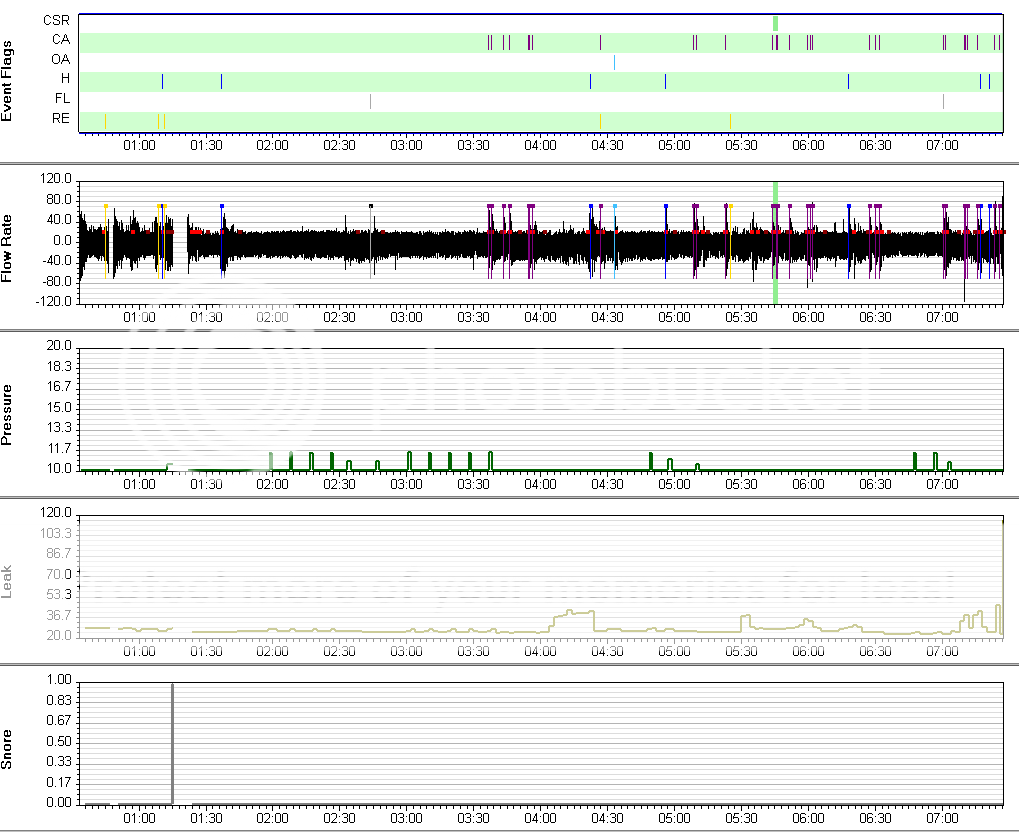
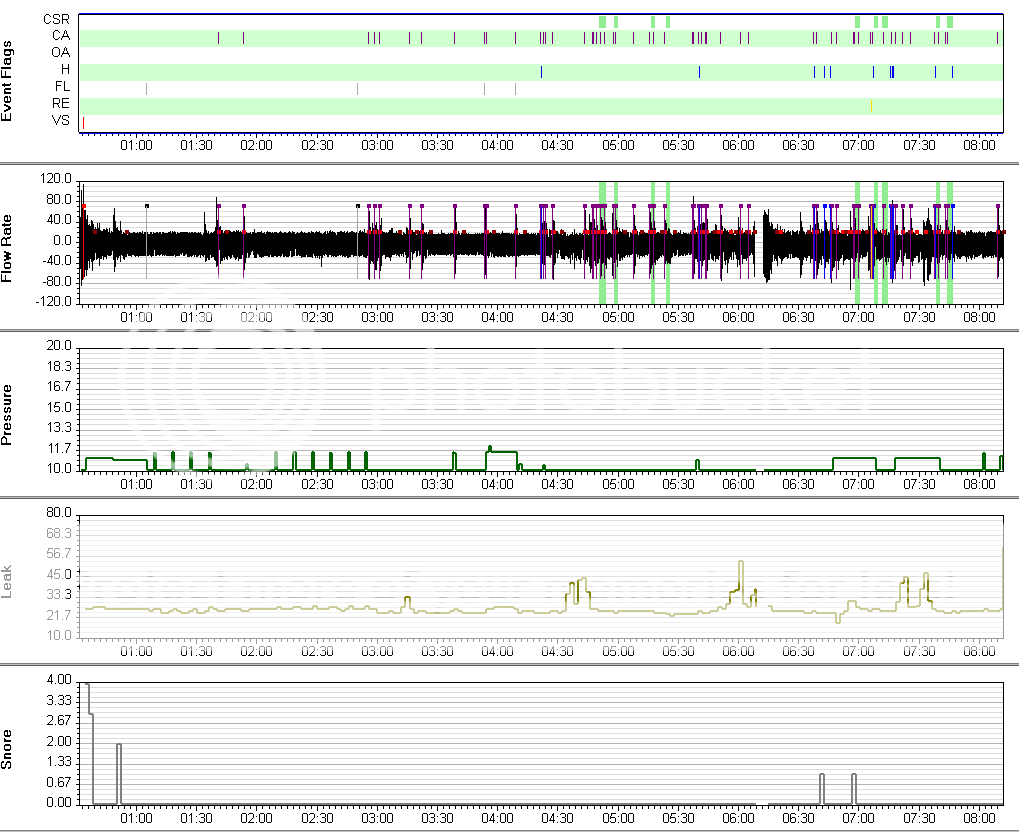
Please take the time to read this thread and click on the links to the report images. 2 pages. It will explain a bit what I am thinking.viewtopic.php?f=1&t=68846&st=0&sk=t&sd=a I don't know that this is your situation. We don't know if you had any centrals in your sleep study.
So much we don't know and about all we do know is that those second half of the night...suck. Why? We don't know yet.

Also..just because the machine flags or scores a Clear Airway event...as Robysue has said..it doesn't mean it is/was a true central that would get us in a panic. Last night my machine flagged 18 CAs over 8 hours. A bit more than I normally see. So I went into SleepyHead and I looked at each event zoomed in to see the level of flow. Only 3 showed a flat line which meant zero flow or zero air movement. The others all had partial flow present. They didn't look like a "real" central. These machines don't have the added data available for scoring centrals. It is a one dimensional report. It gets close but the machine can't tell if you held your breath turning over in bed or even if you happened to be awake or semi awake when it is common to have sleep transition centrals.

So we can't see from your reports if these are true flat line cessation of air movement or just a reduced flow.

We will need to do more detective work.

If it were me.. I would lower the minimum to 9 and not raise the minimum at all. Your obstructives are already well treated. And the centrals (if they are true) aren't treated with increase in pressure.

_________________
Machine: AirCurve™ 10 VAuto BiLevel Machine with HumidAir™ Heated Humidifier
Additional Comments: Mask Bleep Eclipse https://bleepsleep.com/the-eclipse/
I may have to RISE but I refuse to SHINE.

greg-g
Posts: 219
Joined: Sun Dec 20, 2009 1:07 am
Location: Tasmania Australia

Re: sleepyhead graph results (good or bad?)

Post by greg-g » Thu Nov 10, 2011 1:07 am

I'm not familiar with the PR system, but is a continuous leak of about 25 l/min or more OK?, or does the PR system show total flow. (My Resmed S9 shows the leak value in sleepyhead).
If the 25 l/min is genuine leak, while its probably just within tolerance, I would have thought it would be preferable to try and reduce this value. It must make it easier for the machine to better determine apneas etc.

_________________
Mask: Swift™ FX Nasal Pillow CPAP Mask with Headgear
Humidifier: S9™ Series H5i™ Heated Humidifier with Climate Control
Additional Comments: CMS-50F, Night Vision camera, Hose hanger, ResScan 3.16, Modified Swift FX with head band and air diffuser.

User avatar
Pugsy
Posts: 65119
Joined: Thu May 14, 2009 9:31 am
Location: Missouri, USA

Re: sleepyhead graph results (good or bad?)

Post by Pugsy » Thu Nov 10, 2011 8:35 am

greg-g wrote:I'm not familiar with the PR system, but is a continuous leak of about 25 l/min or more OK?, or does the PR system show total flow. (My Resmed S9 shows the leak value in sleepyhead).
If the 25 l/min is genuine leak, while its probably just within tolerance, I would have thought it would be preferable to try and reduce this value. It must make it easier for the machine to better determine apneas etc.
Respironics machines report Total Leak unlike your ResMed machine which reports only excess leak.
For us, this is a good leak line since it is pretty much spot on with the intentional vent rate for this mask at this pressure. A couple of little blips with more leak but not horrible by any means. ResMed's magic number to avoid is 24 L/min and Respironics' magic leak number to avoid is near 90 L/min.

Now there is a way to set the software (depending on SleepyHead version) to show only excess leak but in this case it is set to show Total leak so 25 L/min here is more like a 0.0 leak on a Resmed machine.

_________________
Machine: AirCurve™ 10 VAuto BiLevel Machine with HumidAir™ Heated Humidifier
Additional Comments: Mask Bleep Eclipse https://bleepsleep.com/the-eclipse/
I may have to RISE but I refuse to SHINE.

allennosleep
Posts: 25
Joined: Tue Nov 08, 2011 10:54 pm

Re: sleepyhead graph results (good or bad?)

Post by allennosleep » Thu Nov 10, 2011 11:00 am

Some notes about last night now that I know a bit more about what to look for.

I tried to download my data but it appears that since I changed my flow rate from 10 to 10.5 last night, the data on my sd card has been changed. Now there is a Clear0Pxxxxxxx folder as well as a regular Pxxxxxxx folder on there. The Pxxxxxxx folder has information from last night (the time stamps on the data files deep in there are all last night) where as the Clear0Pxxxxxxxx folder has data from the past 1.5 months. I can't get sleepyhead to pull the new data as when I point at any folder top bottom or indifferent, it says there is no data. (arghh!!!)

I woke up a couple times in the morning with dry mouth. Every time I did, I had turned to lay on my back. It appears that when I lay on my back I start breathing through my mouth which causes me to wake up with dry mouth.

Soon as I figure out whats wrong with my pulling data into sleepyhead, I'll post last night.

User avatar
Pugsy
Posts: 65119
Joined: Thu May 14, 2009 9:31 am
Location: Missouri, USA

Re: sleepyhead graph results (good or bad?)

Post by Pugsy » Thu Nov 10, 2011 11:17 am

Use the drive that the SD card is in... as your "folder".
Like this. When you go into the actual folder you have gone to far.
Increasing your pressure did not affect your machine's ability to score the data.
Image

_________________
Machine: AirCurve™ 10 VAuto BiLevel Machine with HumidAir™ Heated Humidifier
Additional Comments: Mask Bleep Eclipse https://bleepsleep.com/the-eclipse/
I may have to RISE but I refuse to SHINE.