
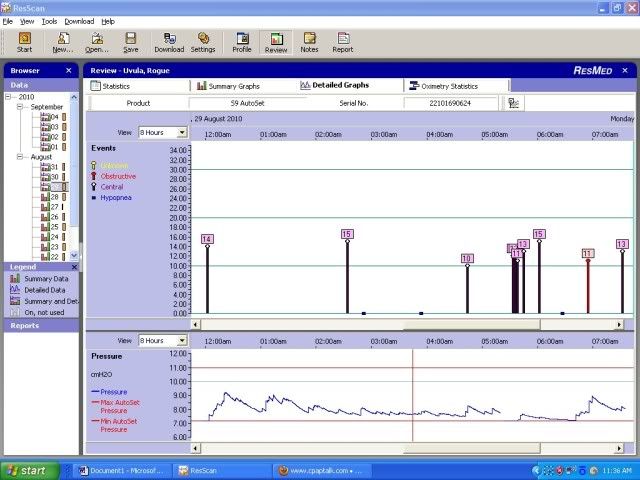
The charts below are fairly typical of my event distributions.
In the top image below (graph of 8 hours), there are 3 Central Events and two Hypopneas between midnight and 5:30 AM (calculated AHI of 0.91).
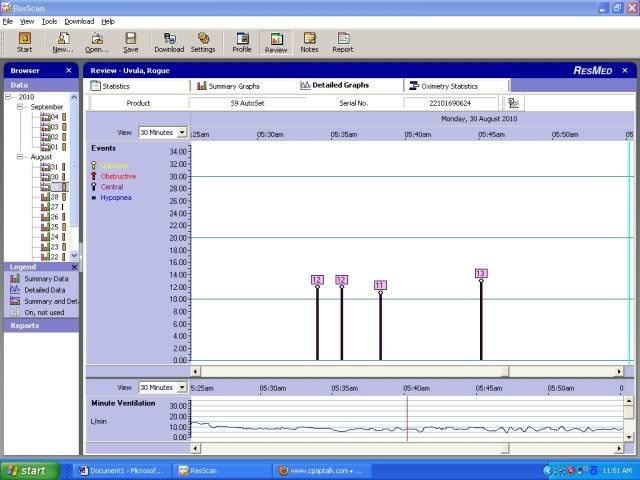
Then, as seen in the second image (expanded to a 30 minute window), there are 4 Central Events between 5:34 and 5:45 AM (calculated AHI of 20).
In the pressure chart of the first image, it looks like there was an interruption in the pressure graph just before this event cluster.
So, here are the questions I have:
1) On other nights, I have seen the same cluster (Centrals only) without the interruption preceding it. Are these clusters likely due to REM sleep? (Right or wrong, that is the interpretation I have been following...and the basis of the following questions)
2) Investigation of the detailed data for that night shows interruption in the flow happened between 5:20 and 5:24AM and I suspect it was a potty trip. Is it likely that the events between 5:34 and 5:45 reflect REM sleep?
3) My AHI numbers fluctuate from night to night. I have a minimum of 1.3 and a maximum of 3.2. When I look at the nights with higher AHI's, I either see two separate clusters like this or a cluster which is sustained for longer duration. So, if my presumption that this is during REM is correct, it seems that on nights my AHI was high, I got lots of REM and on nights it was low, not so much. So, is a high AHI really bad if I see this pattern consistent with extended REM time?
4) If so, is there anything I can do about these clusters of Centrals?
As background, during my original (non-CPAP) sleep study my REM AHI was 25.9 and nonREM AHI was 5.4, with a Total Sleep Time AHI of 8.3.
Thanks for the Help!