wondering how to easily plot sleep data (ResScan)
wondering how to easily plot sleep data (ResScan)
Is there any way to make a traditional graph (X - Y coordinates) of two sets of data from ResScan from within the software?...or move certain data to Excel and make the plot? I'd like to plot Apnea events vs pressure (low and high) to visually see if there is an ideal setting. (I also want to show my sleep doc that higher pressure doesn't necessarily reduce apnea events...which is my observation but I'd like to show hard data.) Of course I can look at my stored data in ResScan and plot it all manually with pencil and graph paper, or copy and paste individual numbers into Excel... but surely there is an easier method.
_________________
| Mask: AirFit™ F10 Full Face Mask with Headgear |
| Humidifier: S9™ Series H5i™ Heated Humidifier with Climate Control |
| Additional Comments: new user |
Re: wondering how to easily plot sleep data (ResScan)
You might try looking at Sleepyhead software.
I don't think it will export to excel, but it goes give you more control over your graphs then ResScan.
I don't think it will export to excel, but it goes give you more control over your graphs then ResScan.
_________________
| Mask: SleepWeaver 3D Soft Cloth Nasal CPAP Mask with Headgear |
| Additional Comments: AurCurve 10 ASV Also using Sleaplyhead 1.1, ResScan 6 and CMS50i |
- Jay Aitchsee
- Posts: 2936
- Joined: Sun May 22, 2011 12:47 pm
- Location: Southwest Florida
Re: wondering how to easily plot sleep data (ResScan)
I think the ResScan summary data graphs do a pretty good job of showing pressure and AHI, but you can export some data including mask pressure and AHI (depending on machine and setting) in CSV format to use in a spreadsheet. In ResScan, select file > export and you'll get a dialogue box to select the patient and date range. I think the S9 might only export pressure data recorded in the auto mode, though. You'll have to try it and see.
CSV data can be exported from Sleepyhead as well.
CSV data can be exported from Sleepyhead as well.
_________________
| Mask: AirFit™ P10 Nasal Pillow CPAP Mask with Headgear |
| Additional Comments: S9 Auto, P10 mask, P=7.0, EPR3, ResScan 5.3, SleepyHead V1.B2, Windows 10, ZEO, CMS50F, Infrared Video |
Re: wondering how to easily plot sleep data (ResScan)
Question,vicktn wrote:Is there any way to make a traditional graph (X - Y coordinates) of two sets of data from ResScan from within the software?...or move certain data to Excel and make the plot? I'd like to plot Apnea events vs pressure (low and high) to visually see if there is an ideal setting. (I also want to show my sleep doc that higher pressure doesn't necessarily reduce apnea events...which is my observation but I'd like to show hard data.) Of course I can look at my stored data in ResScan and plot it all manually with pencil and graph paper, or copy and paste individual numbers into Excel... but surely there is an easier method.
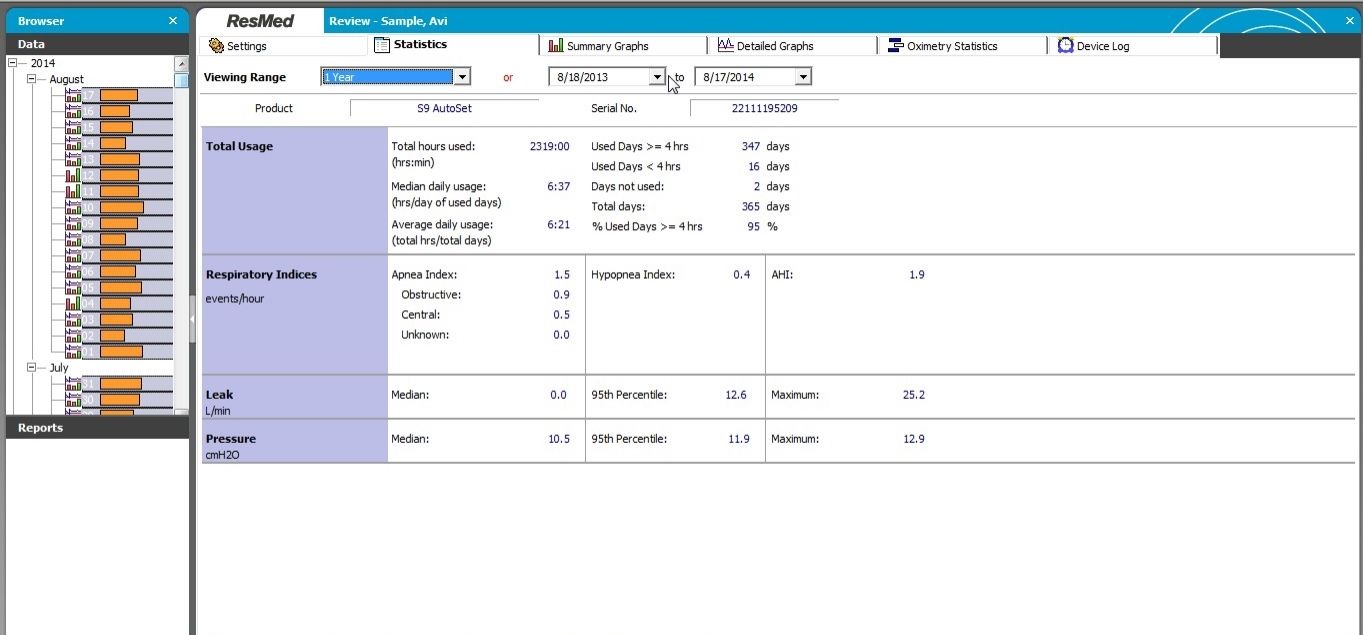
Why would I need it in Excel? I get the following tables and graphs from ResScan 4.5 software:

The values in the following table are MEDIANS (except the hours):

With the Resmed company the newer the version of the S9 ResScan, the slower it works to process the data. What could be the reasons?
_________________
| Humidifier: S9™ Series H5i™ Heated Humidifier with Climate Control |
| Additional Comments: S9 Autoset machine; Ruby chinstrap under the mask straps; ResScan 5.6 |
see my recent set-up and Statistics:
http://i.imgur.com/TewT8G9.png
see my recent ResScan treatment results:
http://i.imgur.com/3oia0EY.png
http://i.imgur.com/QEjvlVY.png
http://i.imgur.com/TewT8G9.png
see my recent ResScan treatment results:
http://i.imgur.com/3oia0EY.png
http://i.imgur.com/QEjvlVY.png
Re: wondering how to easily plot sleep data (ResScan)
Thanks. I'll try the export feature.
AVI123: The detailed graphs are fine for individual nights. I want to plot individual data points (one per night) over a two month period. The summary graphs/data will only average a time span.
AVI123: The detailed graphs are fine for individual nights. I want to plot individual data points (one per night) over a two month period. The summary graphs/data will only average a time span.
_________________
| Mask: AirFit™ F10 Full Face Mask with Headgear |
| Humidifier: S9™ Series H5i™ Heated Humidifier with Climate Control |
| Additional Comments: new user |
Re: wondering how to easily plot sleep data (ResScan)
I tried the export feature, but when I opened the .csv file in Excel, there was no data.
_________________
| Mask: AirFit™ F10 Full Face Mask with Headgear |
| Humidifier: S9™ Series H5i™ Heated Humidifier with Climate Control |
| Additional Comments: new user |
Re: wondering how to easily plot sleep data (ResScan)
Interesting concept.vicktn wrote:Is there any way to make a traditional graph (X - Y coordinates) of two sets of data from ResScan from within the software?...or move certain data to Excel and make the plot? I'd like to plot Apnea events vs pressure (low and high) to visually see if there is an ideal setting. (I also want to show my sleep doc that higher pressure doesn't necessarily reduce apnea events...which is my observation but I'd like to show hard data.) Of course I can look at my stored data in ResScan and plot it all manually with pencil and graph paper, or copy and paste individual numbers into Excel... but surely there is an easier method.
You should see the new "By Pressure" chart in the latest sleepyhead source code version... It automatically calculates all the event indices at each pressure live as you zoom and scroll through your data.

I'm about to add a mode for this graph that switches between the text format and a dual Y axis graphical plot that shows all the indices vs Time at pressure.
There is of course the old Changes in Prescription settings list in statistics, which highlights your best and worst setting yet, but you'll want an up to date version for the pressure/mode/flex strings to be accurate.
_________________
| Machine: ResMed AirSense™ 10 AutoSet™ CPAP Machine with HumidAir™ Heated Humidifier |
| Mask: Swift™ FX Nasal Pillow CPAP Mask with Headgear |
| Humidifier: S9™ Series H5i™ Heated Humidifier with Climate Control |
| Additional Comments: CMS50D+/F Oximeter, S9 VPAP Auto/Adapt, PRS1 Auto, Intellipap Auto, SleepyHead :) |
Author of the free, cross platform, open-source sleep tracking software SleepyHead.
Download http://sleepyhead.jedimark.net
Source Code http://gitlab.com/sleepyhead/sleepyhead-code
Download http://sleepyhead.jedimark.net
Source Code http://gitlab.com/sleepyhead/sleepyhead-code
- Jay Aitchsee
- Posts: 2936
- Joined: Sun May 22, 2011 12:47 pm
- Location: Southwest Florida
Re: wondering how to easily plot sleep data (ResScan)
I did have a problem exporting from ResScan 4.3. I posted about it, but no one else seemed to have the same problem so I thought it was some sort of glitch in my setup, maybe not. Previous versions of ResScan and ResScan 4.5 have worked OK for me.vicktn wrote:I tried the export feature, but when I opened the .csv file in Excel, there was no data.
Here's the thread where I discussed my problem with 4.3 viewtopic/p904821/viewtopic.php?f=1&t=9 ... 69#p901305
Not sure what you mean. The attached snip of Summary Graph shows pressure and ahi individually by night over an approximate 2 month time span.vicktn wrote:I want to plot individual data points (one per night) over a two month period. The summary graphs/data will only average a time span.

_________________
| Mask: AirFit™ P10 Nasal Pillow CPAP Mask with Headgear |
| Additional Comments: S9 Auto, P10 mask, P=7.0, EPR3, ResScan 5.3, SleepyHead V1.B2, Windows 10, ZEO, CMS50F, Infrared Video |
Re: wondering how to easily plot sleep data (ResScan)
Jay Aitchsee wrote:
Yeah...you've illustrated it well...that's exactly the data I want to present...only in an X-Y plot that would more clearly show whether/how AHIs track pressure. Bar graphs are fine as far as they go, but it's very difficult to compare one with the other, even when aligned. In your example, of course, you've kept the pressure fairly constant, but I have been changing it frequently, trying to find a "sweet spot".Not sure what you mean. The attached snip of Summary Graph shows pressure and ahi individually by night over an approximate 2 month time span.
_________________
| Mask: AirFit™ F10 Full Face Mask with Headgear |
| Humidifier: S9™ Series H5i™ Heated Humidifier with Climate Control |
| Additional Comments: new user |
Re: wondering how to easily plot sleep data (ResScan)
Comment,vicktn wrote:
Yeah...you've illustrated it well...that's exactly the data I want to present...only in an X-Y plot that would more clearly show whether/how AHIs track pressure. Bar graphs are fine as far as they go, but it's very difficult to compare one with the other, even when aligned. In your example, of course, you've kept the pressure fairly constant, but I have been changing it frequently, trying to find a "sweet spot".
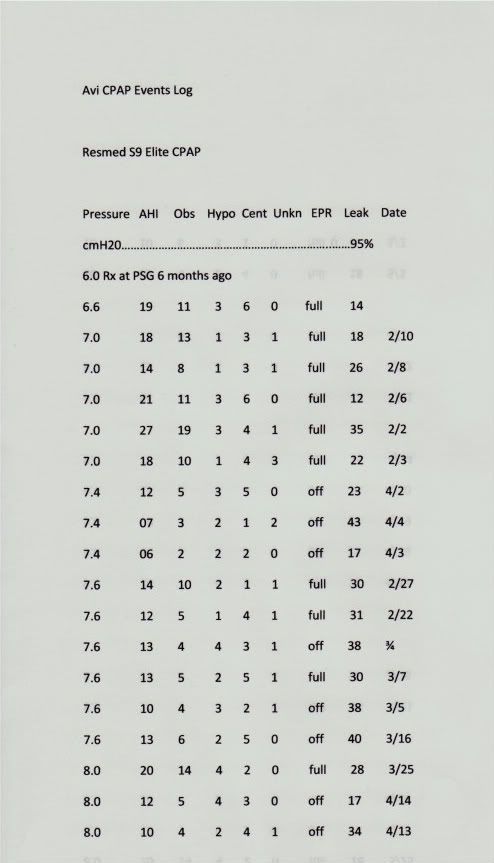
There is no need for the AHIs to be accurately pressure depended b/c our bodies don't work like a clock. See here that while I titrated myself 3 years ago there has not been any linear function of AHIs vs Pressure:
All done at begin of 2011
_________________
| Humidifier: S9™ Series H5i™ Heated Humidifier with Climate Control |
| Additional Comments: S9 Autoset machine; Ruby chinstrap under the mask straps; ResScan 5.6 |
see my recent set-up and Statistics:
http://i.imgur.com/TewT8G9.png
see my recent ResScan treatment results:
http://i.imgur.com/3oia0EY.png
http://i.imgur.com/QEjvlVY.png
http://i.imgur.com/TewT8G9.png
see my recent ResScan treatment results:
http://i.imgur.com/3oia0EY.png
http://i.imgur.com/QEjvlVY.png
Re: wondering how to easily plot sleep data (ResScan)
Is this what you meant? This was something that I had wondered about also. Sleepyhead has an easy export function to CSV, and it's easy to plot in Excel. Here's what I looked at just for grins (pressure on horizontal axis and number of events on vertical):


My pressure has been set to a range of 9-12 for the last couple of weeks, with much better results than the previous setting of 7-12.
I didn't run this data until today, and thought it was interesting. By the number of dots and the number of posts, you can see I'm quite the newbie, but am doing much better lately. If I could eliminate the number of bathroom runs each night, because it takes a while to fall asleep after, I'll bet I'd feel much better and the numbers would reflect that.
This has been quite a ride so far! Thanks to all for all your helpful posts...
_________________
| Mask: Nuance & Nuance Pro Nasal Pillow CPAP Mask with Gel Nasal Pillows |
| Humidifier: S9™ Series H5i™ Heated Humidifier with Climate Control |
| Additional Comments: Also use Airfit N10, P10, and Sleepweaver Advance masks; Sleepyhead tester; PRS1 Auto as backup; CMS 50E pulse ox, ZEO; humidity 3.0 no heat |
- Jay Aitchsee
- Posts: 2936
- Joined: Sun May 22, 2011 12:47 pm
- Location: Southwest Florida
Re: wondering how to easily plot sleep data (ResScan)
VickTn, I think you'd enjoy this. From an old thread I started some time back.
viewtopic.php?f=1&t=85585#p778673
viewtopic.php?f=1&t=85585#p778673
Jay Aitchsee wrote:Here's a chart I thought you might find interesting. It's my ResScan and Zeo data from July 2011 into Jan 2013. I created it by using the “export” function of both applications, exporting the data in CSV format into a spreadsheet (I use Open Office) and then selecting the variables to chart. I used 15 day moving averages to smooth the results a bit. The thing that really stands out is the increase in Deep Sleep in the last few months.
I have been using XPAP for more than 5 years, but like many, I continued to suffer from fatigue. So, about 3 years ago, I really started to work at becoming compliant, improving my sleep hygiene, and trying prescriptions to calm my diagnosed PLMD (none worked, BTW). Around October of 2011, I changed my diet to exclude most processed foods and have lost about 20 lbs. About that time, I also looked at my blood work and began supplementing my deficiencies, namely D3, B12, and Thyroid, all of which were low.
Prior to July 2011, my Deep Sleep as measured by 3 PSG's and Zeo had always been less than 10 minutes. I figured if I could increase my Deep Sleep, my fatigue would improve.
So now, my Deep Sleep as measured by Zeo has improved a lot. Nearly normal for my age. Is Zeo right? Has my Deep Sleep actually improved? I think yes. My fatigue is better, not miraculously, but better. I feel different in the mornings. I actually feel a little more groggy when I first wake than I used to, and I think most telling, is that I am not getting up at all during the night. Three or four years ago, I was getting up 2 or 3 times a night. Lately, not at all!
So, if my Deep Sleep has increased...why? It would be easy to say it was the mask or the CoQ10, or perhaps a combination of factors (most likely). Or, perhaps something else altogether. Looking at the data, it appears my Deep Sleep improves as daylight savings time ends. Coincidence? Maybe.
So, I'm going to continue doing what I'm doing, try to practice good sleep hygiene, keep looking for the most comfortable non leaking mask, watch my blood work, and see what happens in the summer.
Your thoughts are welcome.
Jay
I know exactly what you're trying to do. I did it myself several years ago the "old fashioned way" by keeping a log and charting the variables. I caution against changing the pressure too frequently. Most find that it takes several days or longer for the body to adjust and "settle in" after a pressure change.vicktn wrote:
... you've kept the pressure fairly constant, but I have been changing it frequently, trying to find a "sweet spot".
_________________
| Mask: AirFit™ P10 Nasal Pillow CPAP Mask with Headgear |
| Additional Comments: S9 Auto, P10 mask, P=7.0, EPR3, ResScan 5.3, SleepyHead V1.B2, Windows 10, ZEO, CMS50F, Infrared Video |


