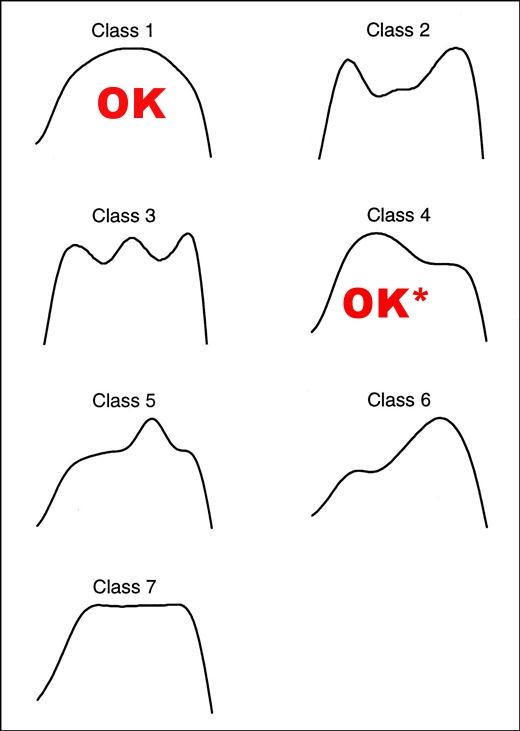
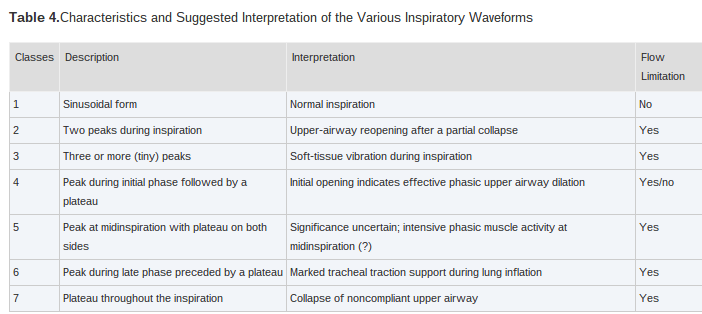
I'll start with something we've seen here before, which is excerpted from an article in CHEST (pulmonary medicine journal) on a proposed classification for UARS breaths as recorded by a consumer xPAP. This is the ONLY scientific/medical portion of this post:


Here's an example of what my "good" breathing looks like all night while asleep:

Here's a look at a typical pattern when things are going bad--notice these breaths come in runs, not in isolation, for me--very much "class 2" from above. Note that you are only evaluating the inspiratory peak (i.e. :

Here's some more (and common/hourly for me) examples of "runs" during otherwise regular periods of breathing (from different nights):


Because of the length and spacing of when they occur and other factors, I can take a wild guess (but can't be certain at all without EEG info, obviously, and this may not generalize to YOUR waveforms, otherwise some xPAP manufacturer would have made millions patenting the algorithm) at when I might possibly be cycling through REM throughout a "good" night. My waveform (zoomed out to about 10-15 minute epochs) goes up and down in an almost "arpeggio", in terms of depth and frequency--but the peaks are still nice and "sharp" except for, again, I'm getting another "bad" run (and events are most common in REM when the airway muscles slacken, and I find that in these periods on my graphs as well). Here's an example of that, zoomed in show peaks:

DISCLAIMER AGAIN: THIS IS FOR ENTERTAINMENT PURPOSES ONLY. [For those of us whose idea of fun is downloading our data every morning. ] These are my personal waves on my particular machine at my particular setting with my particular mask and are not meant to be diagnostic of anyone else. I wouldn't presume to analyze anyone else's data: epochs like these don't necessarily mean you have UARS, not getting waveforms like this doesn't mean you DON'T have UARS, talk to your doctor, etc. If you've got a UARS diagnosis yourself, feel free to add your own!


