Disclaimer: I already know that even healthy breathers show resistance patterns on and off through the night, and breathing necessarily goes from regular to...rough...throughout the night as part of normal sleep stage cycling.
The graphs below are from different nights, and are not always scaled to the exact epoch length.
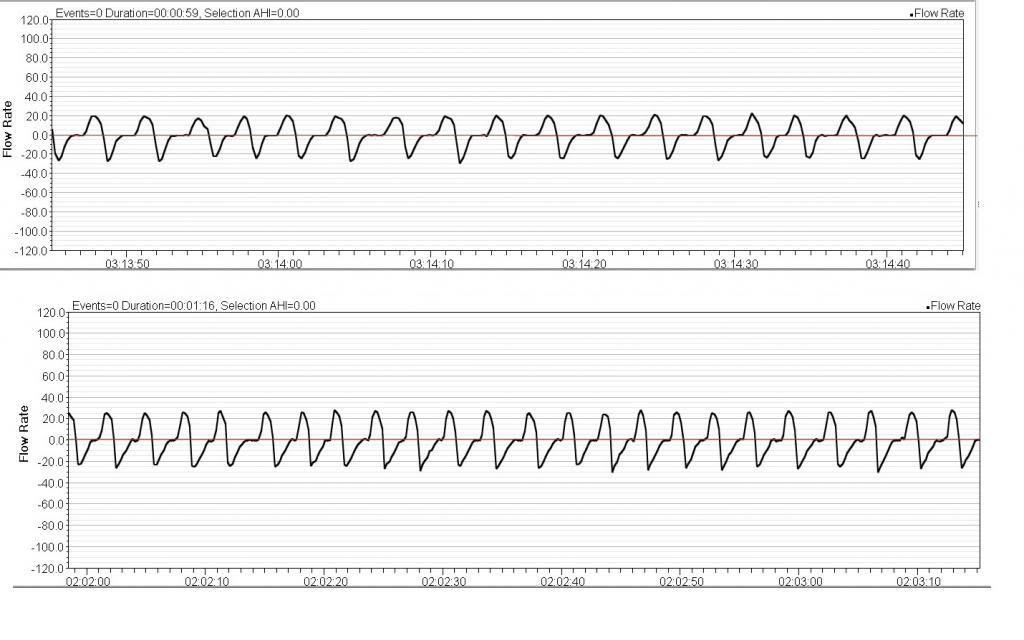
Rare for me is the "asleep but regular and smooth" shape, which is pretty textbook:

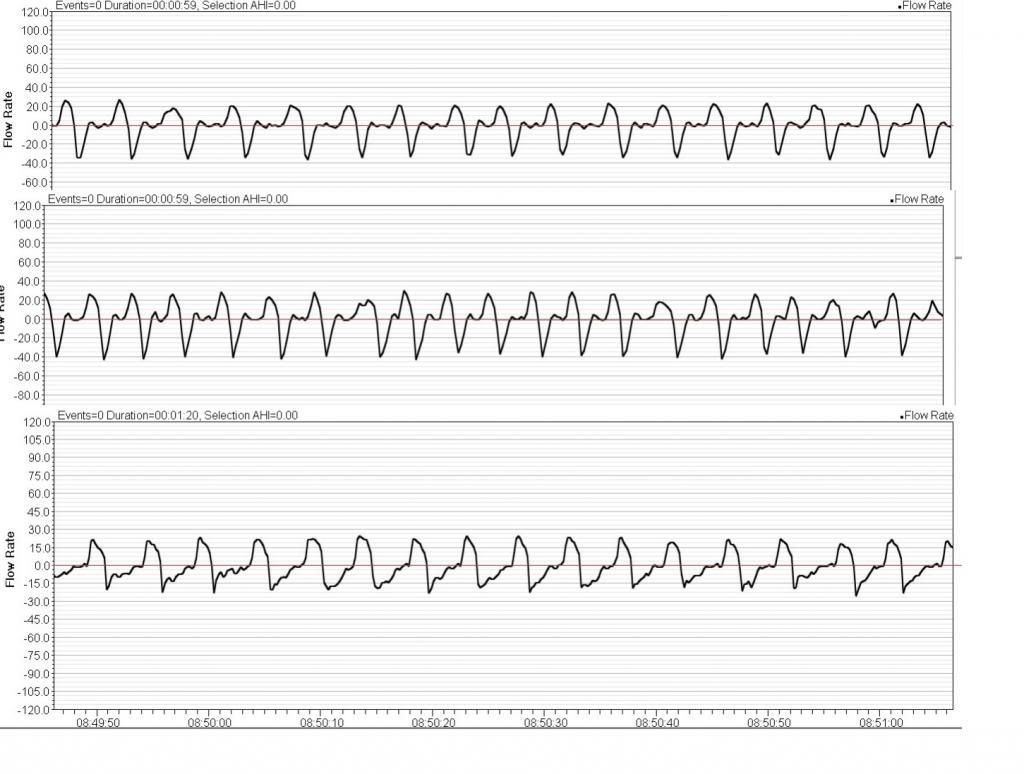
Here are the "toothy" oddities I'm wondering about--machine/flex settings/normal variation/sleepyhead artifacts, or flow resistance? I get this the majority of the evening when breathing is regular--I didn't just hunt and peck for the below examples:

And here's what definite flow limitations look like on the PR1 for me (the "molars"):

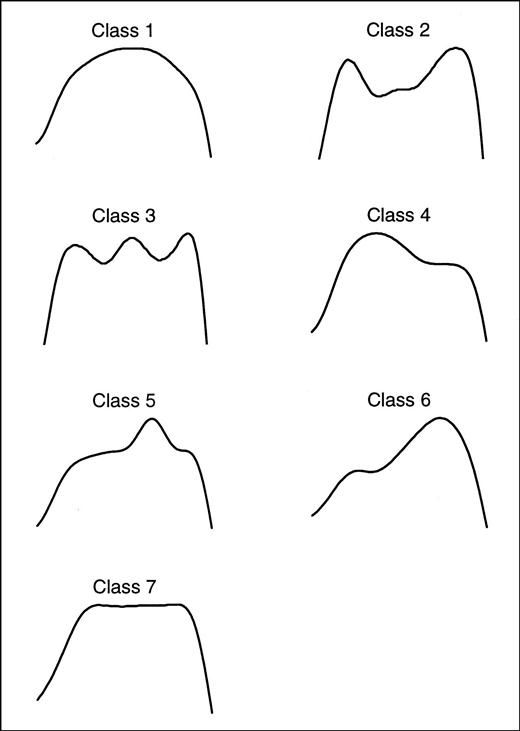
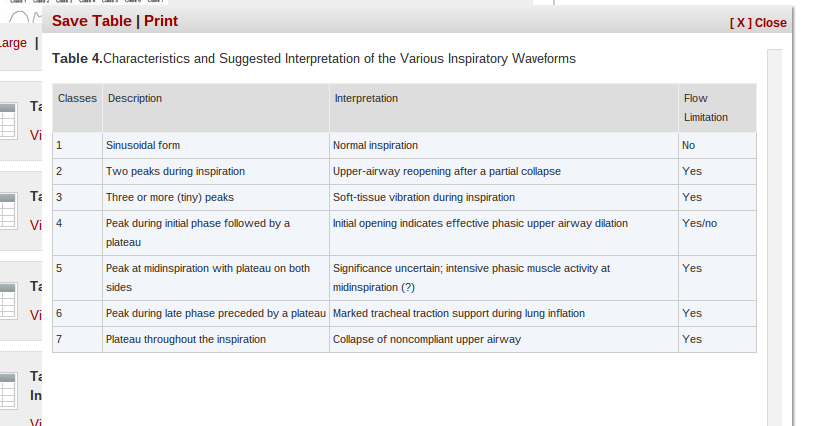
And here's a guide to waveform shapes published in a study evaluating what UARS might look like on inspiration. Class 1 and 4 are considered normal:


From this article: http://journal.publications.chestnet.or ... id=1079416
Disclaimer: yes, these shapes are based on lab equipment, not consumer-grade BiPap therapy machines, and only my doctor knows for sure. But I'm very new at looking at this kind of data (or even a data capable machine), and I'd love to compare notes with those who know more, even if this is just the equivalent of reading tea leaves.


