I started with a clone WII controller and an Arduino microcontroller. That project was scrapped well before the fruition because I became concerned after waking a few times with the CPAP hose wrapped around my neck. I was concerned that I might strangle myself in my sleep with a thin cord.
I spent many hours looking for an affordable compact data logger with an integrated multiple axis accelerometer. I settled on X16-1C from Gulf Coast Data Concepts, LLC. It's bigger and heavier than I would like but it's also ½ to to 1/3 the price of the next better choices.
http://www.gcdataconcepts.com/xlr8r-1.html
The graph is a result of a short test displayed in the tool that came with the device. The highlighted areas are walking between bed and computer. The other area is the actual test. I held the device on my head where I intend to strap it onto my CPAP headgear. The red line at center is when facing ceiling. Then it rises to indicate left side of my face in the pillow and falls to indicate right side in pillow. The squiggles in the green and blue lines are a few sit up like gestures just to see how they would be displayed.
The test convinced me to forge ahead and integrate the data into my monitoring application. The first night my attempt at strapping the device to my headgear failed. Night 2 was better but I had not configured the device properly and had way too much data to be useful. The stars aligned on night three with good data for the full night. A few more hours of hacking code and now it's mostly integrated. Scaling is still somewhat arbitrary and the other two channels still need to be integrated to be able to tell if I am face up or have my face buried in the pillow.
This is one of those strange waves mentioned above. It shows about 20 seconds of breathing. The horizontal represent plus and minus 25 lpm. Note the one larger inhalation followed by a period hovering around zero.
Here it is again with overlaid head position data. The blue line shows rolling over from right side down to right side up. I appear to be holding my breath while moving.
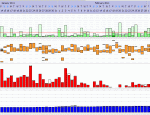
Here is a 5 hour slice of the night showing periodic roll overs.
Another benefit is being able to explain some of the loss of signal in the CMS50. The blue line shows activity in the more less same position. The orange lines in the pink panel is where the Oximeter has lost signal. The green lines are SpO2, the blue line heart rate. There is a strong correlation with the head movement and lost signal. I'm guessing my hand moved too.
The device can also be strapped to a leg monitor Restless Leg Syndrome.


