


So the data is there, just not readily available? I have Encore Pro and can get Analyzer if that will bring it out. Just didn't know if my M Series Pro collected that type of data or if it was only on APAP/BiPAPs.-SWS wrote:I think Wulfman had mentioned somewhere in this thread that the RemStar Pro 2 records VB data. Klochemy, that VB data is hiding in the SQL data structures on the card. It takes a third party utility to bring it out.
Feeling_better, interesting and wonderful are two words that come to mind regarding your data project. Have you been able to correlate any kind of following-day subjective assessment(s) with certain VB characteristics or even overall VB index?
Encore Analyzer Variable Breathing Poll
Re: Encore Analyzer Variable Breathing Poll
Re: Encore Analyzer Variable Breathing Poll
Klockemy, that VB data should be sitting on your card as well. Then it sounds as if feeling_better is hoping for beta testers.
It would be nice to see BleepingBeauty's VB distributions using feeling_better's software. CompSAS hint, hint, BleepingBeauty.
It would be nice to see BleepingBeauty's VB distributions using feeling_better's software. CompSAS hint, hint, BleepingBeauty.
-
BleepingBeauty

- Posts: 2454
- Joined: Thu Apr 02, 2009 5:30 pm
- Location: Aridzona ;-)
Re: Encore Analyzer Variable Breathing Poll
*Raising my hand from the back row*-SWS wrote:Klockemy, that VB data should be sitting on your card as well. Then it sounds as if feeling_better is hoping for beta testers.
It would be nice to see BleepingBeauty's VB distributions using feeling_better's software. CompSAS hint, hint, BleepingBeauty.
I hear ya, -SWS, and I got the hint.
Software and reader are on the way! Hope to have both by Monday. I'll likely need a little time to get everything sorted out on my end, as I generally handle the basics of computing pretty well but am definitely no techno-wizard. As soon as I can, I'll respond with what I find in my reports. This is exciting!
FWIW, last night's data (from the machine's LCD) indicates a leak rate of 29.5 L/min (Swift guide says 33 is max at my pressure of 12cm) and an AHI of 7.7. Can't wait to get to work on lowering those numbers...
Veni, vidi, Velcro. I came, I saw, I stuck around.
Dx 11/07: AHI 107, central apnea, Cheyne Stokes respiration, moderate-severe O2 desats. (Simple OSA would be too easy. )
)
PR S1 ASV 950, DreamWear mask, F&P 150 humidifier, O2 @ 2L.
Dx 11/07: AHI 107, central apnea, Cheyne Stokes respiration, moderate-severe O2 desats. (Simple OSA would be too easy.
PR S1 ASV 950, DreamWear mask, F&P 150 humidifier, O2 @ 2L.

Re: Encore Analyzer Variable Breathing Poll
I posted the following to another thread, Re: (Another) Respironics Encore Data Failure, that Velbor started and I have been participating in. Since I may be at the low % end re experiencing Variable Breathing, I thought it might be useful for me to post my sample Night Events charts, with and without VB. I plan to look at my VB numbers, even though they may be very low (< 10% on average), to see if I can discern any information that may help me in my Sleep Apnea therapy. My postings to the forum thread mentioned above provides some background on the data analyses that I am doing and plan to do.

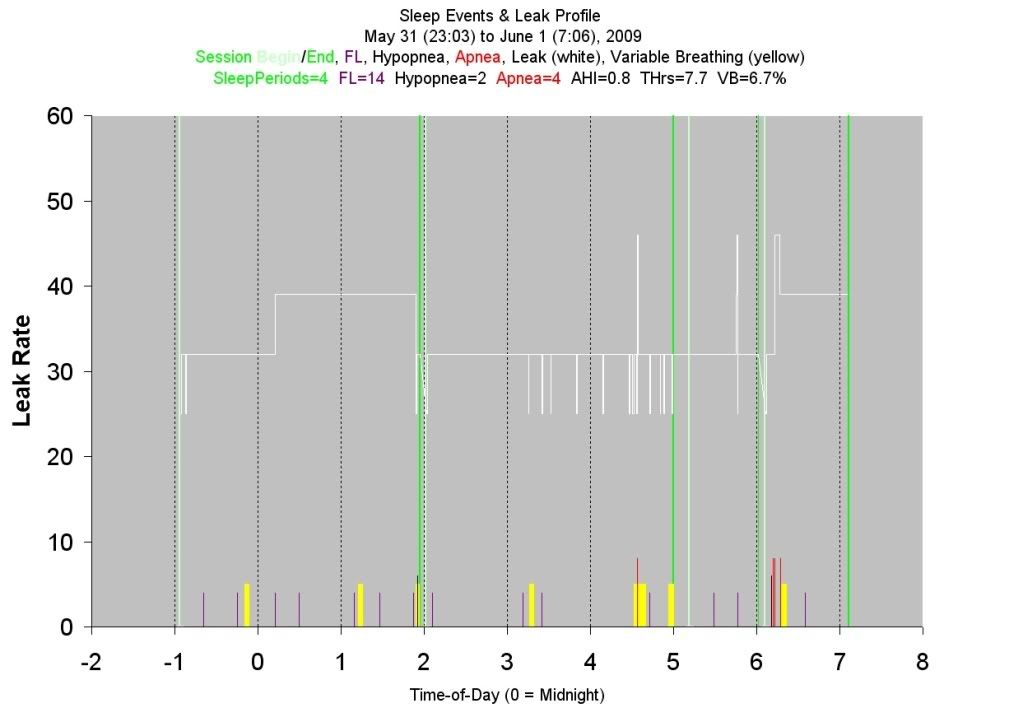
I created a MS Excel (2003) template for charting my nightly sleep events. The chart includes leak, snore, flow limitation, hypopnea, obstructive apnea, and non-responsive apnea (I've only experienced two and that was in early April). I've also created another template that adds Variable Breathing. I use the tables in the Encore Pro SQL database as input. I have color coded the events so they are visible on my display (1600x1200) and on printouts (Epson Inkjet). I am posting two sample charts. My next goal is to automate the process so I can create a Night Event chart in a few minutes each morning. A long term goal is to provide a "Zoom" capability when viewing the charts. My Variable Breathing %, as reported by the Encore Pro Analyzer, has averaged less than 10%/night the past month, with one night registering 1.5%. I plan to look at VB to see if it can tell me something, good or bad, about my sleep apnea therapy.
_________________
| Machine: AirSense™ 10 CPAP Machine with HumidAir™ Heated Humidifier |
| Mask: ResMed AirFit™ F30 Full Face CPAP Mask with Headgear |
| Additional Comments: CPAP Auto with Min 10, Max 12, and OSCAR |
Last edited by cinco777 on Sun Jun 14, 2009 12:58 pm, edited 1 time in total.
I live in my body. I know my body better than anyone else in the world. I may consult a medical professional for advice, but no one, and I do mean NO ONE tells me what I am permitted to do. - Kiralynx
-
feeling_better

- Posts: 803
- Joined: Sun Jun 01, 2008 7:08 pm
Re: Encore Analyzer Variable Breathing Poll
cinco777, I do not know if you have seen the few graphs I posted a few msgs back in this thread (yesterday). Since a new page started in this thread right after that, you might have missed it? I am working on a software package for doing all these automatically. The output I posted is from that software, and I am looking for some beta testers...cinco777:..My next goal is to automate the process so I can create a Night Event chart in a few minutes each morning...
Resmed S9 Elite cpap mode, H5i Humidifier, Swift FX Bella L nasal pillows

Re: Encore Analyzer Variable Breathing Poll
Absolutely, it's there. I've been looking at it for over 4 years. It's been discussed to some degree that the Pro 2 and the M Series Pro are probably using the same basic internal "stuff" that's in the Auto machines......they just turned off/locked out the Auto functions. When Derek wrote the MyEncore software (early 2005), he found the VB data in the database and added it into the reports. James Skinner also continued with the same data in his Encore Pro Analyzer.klockemy wrote:So the data is there, just not readily available? I have Encore Pro and can get Analyzer if that will bring it out. Just didn't know if my M Series Pro collected that type of data or if it was only on APAP/BiPAPs.-SWS wrote:I think Wulfman had mentioned somewhere in this thread that the RemStar Pro 2 records VB data. Klochemy, that VB data is hiding in the SQL data structures on the card. It takes a third party utility to bring it out.
Feeling_better, interesting and wonderful are two words that come to mind regarding your data project. Have you been able to correlate any kind of following-day subjective assessment(s) with certain VB characteristics or even overall VB index?
Den
(5) REMstar Autos w/C-Flex & (6) REMstar Pro 2 CPAPs w/C-Flex - Pressure Setting = 14 cm.
"Passover" Humidification - ResMed Ultra Mirage FF - Encore Pro w/Card Reader & MyEncore software - Chiroflow pillow
User since 05/14/05
"Passover" Humidification - ResMed Ultra Mirage FF - Encore Pro w/Card Reader & MyEncore software - Chiroflow pillow
User since 05/14/05
Re: Encore Analyzer Variable Breathing Poll
FeelingBetter,
I sent you a PM two days ago (Thursday, June 11) asking you to add me to your list. You mentioned that it would be a few weeks before the beta testing would begin. I didn't want to wait so I created some MS templates and made a few sample charts (I have, for the past 1 1/2 months, been downloading the Encore Pro SQL sleep event table data to a MS Excel spreadsheet). I plan to change my chart colors - maybe use white against a gray background for the leak profile, etc. This evening, I spent some time automating my data download and chart making process, and will now be able to create a night event chart the following morning in less than 10 minutes. I'm going to look at implementing a Zoom capability, similar to what is provided by my runner's watch software (PolarProTrainer5). I use its Zoom function often and have found it very useful in scrutinizing the data (heart rate, cadence, pace, etc.) over a smaller interval to analyze and improve my running efficiency.
Hope you make good progress in your charting efforts.
Jim
_________________
| Machine: AirSense™ 10 CPAP Machine with HumidAir™ Heated Humidifier |
| Mask: ResMed AirFit™ F30 Full Face CPAP Mask with Headgear |
| Additional Comments: CPAP Auto with Min 10, Max 12, and OSCAR |
I live in my body. I know my body better than anyone else in the world. I may consult a medical professional for advice, but no one, and I do mean NO ONE tells me what I am permitted to do. - Kiralynx
-
feeling_better
- Posts: 803
- Joined: Sun Jun 01, 2008 7:08 pm
Re: Encore Analyzer Variable Breathing Poll
Jim, please check my pm of just a few minutes ago. Sorry for the mix up...cinco777 wrote:FeelingBetter,
I sent you a PM two days ago (Thursday, June 11) asking you to add me to your list.
Jim
Resmed S9 Elite cpap mode, H5i Humidifier, Swift FX Bella L nasal pillows
-
feeling_better
- Posts: 803
- Joined: Sun Jun 01, 2008 7:08 pm
Re: Encore Analyzer Variable Breathing Poll
-SWS, That is a very intriguing question! I would like to find that out too You see, after knowing about the vb data a long while back and not looking at it often, I had sort of lost interest in it and had almost forgotten it, until you resurrected this very old thread of yours. Even though I have a quite bit of my old daily data, I never kept any 'Feeling_better's Diary'. So no way to tell now. Now that I can plot the distribution of vb over each sleep period automatically, as part of my daily data observance (:)) I may be able to tell you after a while.-SWS wrote:... the RemStar Pro 2 records VB data. Klochemy, that VB data is hiding in the SQL data structures on the card. It takes a third party utility to bring it out.
Feeling_better, interesting and wonderful are two words that come to mind regarding your data project. Have you been able to correlate any kind of following-day subjective assessment(s) with certain temporal VB characteristics or even overall VB index?
This brings up a question, where you are an expert about generally. How exactly is VB defined and/or detected? I could find rather good details of all of the other terms Resp. uses, but nothing really about vb. This morning just prior to getting up, for a full 10 minutes I did very regular, but unusually long, deep (<7 breaths/minutes) breathing. But the data shows a lot of vb during that time
Resmed S9 Elite cpap mode, H5i Humidifier, Swift FX Bella L nasal pillows
Re: Encore Analyzer Variable Breathing Poll
Feeling_better I just got your PM, and I'm sorry I missed the above comments and question. Regarding the specifics of that VB statistic residing on the Smartcard: we don't know for certain how Respironics employs that statistical measurement that goes unreported by Encore Pro. However, among the "VB guessers" on this message board, I subscribe to the theory that VB in the SQL data tables probably corresponds to the VB criteria that Respironics looks for when sending APAP pressure response off to the VB Control Layer:feeling_better wrote: How exactly is VB defined and/or detected? I could find rather good details of all of the other terms Resp. uses, but nothing really about vb. This morning just prior to getting up, for a full 10 minutes I did very regular, but unusually long, deep (<7 breaths/minutes) breathing. But the data shows a lot of vb during that time
So the Respironics VB Control Layer will routinely usurp control away from the lower-priority APAP Control Layer whenever breathing gets erratic for an entire variety of reasons. You'll note from the description above that some of those reasons for VB reflect good sleep (such as REM) while other reasons for VB reflect counterproductive sleep conditions. And that's what makes VB an inherently ambiguous stand-alone statistic IMO. A high VB percentage likely reflects some commensurate percentage of time spent away from the lower-priority APAP control layer.Respironics patent description wrote:H. Variable Breathing Control Layer
The auto-CPAP controller, which is described in the next section, relies on the ability to trend the steady rhythmic breath patterns associated with certain stages of sleep. When a patient is awake, in REM sleep, or in distress, breathing tends to be more erratic and the Auto-CPAP trending becomes unstable. It is, therefore, important to interrupt the auto-CPAP controller if the patient's breathing pattern becomes too variable. In essence, the variable breathing control layer keeps the Auto-CPAP control layer from being too erratic.
Referring back to FIG. 2, the variable breathing control layer, which is assigned a seventh (7th) priority, includes a variable breathing detector 270 , a variable breathing monitor 272 , and a variable breathing controller 274 . As described in greater detail below, the variable breathing control layer performs statistical analysis on the scatter of the trended weighted peak flow data to detect unstable breathing patterns or abrupt changes in patient response. When activated, variable breathing control module 274 takes priority over the auto-CPAP controller, so that when a valid variable breathing indication is provided by variable breathing monitor 272 , control of the pressure support system is turned over to the variable breathing controller. In short, activation of variable breathing control module 274 interrupts the operation of the auto-CPAP controller when breathing becomes unstable and appropriately manages any necessary pressure changes.
1. Variable Breathing Detection and Monitoring
Variable breathing detection module 270 monitors the weighted peak flows Q Wpeak over a moving window, which in a presently preferred embodiment, is a four (4) minute window. The detection module in essence trends four minutes worth of weighted peak flow information to determine whether this information is becoming too erratic. FIGS. 10A and 10B are graphs illustrating examples of the scatter of weighted peak flows. In FIGS. 10A and 10B, the weighted peak flows are relatively closely bunched around a trend line 276 in area 278 and is relatively scattered from the trend line in area 280 . Trend line 276 is a best-fit line determined using any conventional statistical analysis technique based on the weighted peak flows data collected during the current 4 minute window. The primary difference between FIGS. 10A and 10B is that the trend line in FIG. 10B is shown with a non-zero slope. This is done to highlight the fact that the trend line is a best-fit line based on the collected data points.
Variable breathing detection module 270 determines the standard deviation of the weighted peak flow data collected during the monitoring window as indicated by dashed lines 282 . It should be noted that the standard deviation is calculated based on the best-fit trend line 276 . It can be further appreciated that a standard deviation 284 is less in region 278 than a standard deviation 286 in region 280 , indicating that the weighted peak flow data is more variable in region 280 .
The present inventors appreciated that using the standard deviation alone as a measure of the degree of variation in the weighted peak flow data may not produce consistently correct results. This is so, because the standard deviation of the weighted peak flow data when the mean patient flow is relatively low is not exactly comparable to the same standard deviation for a higher mean patient flow. The present invention, therefore, seeks to normalize the standard deviation to the mean patient flow, and then takes the mean flow into consideration when analyzing the variation in the data.
FIG. 11 is a chart illustrating a normalization curve 290 that describes the relationship between the mean patient flow and an adjusted mean patient flow. It can be appreciated from reviewing this figure that there is a linear region 292 in which the adjusted mean flow (vertical axis) has a one-to-one match with the actual mean flow (horizontal axis). If the patient's mean flow for the 4 minute window is within region 292 , no adjustment to this mean flow is made. There is also a first region 294 having a ½ to one relationship between the adjusted mean flow and the actual mean flow. Thus, if the actual mean flow falls within region 294 , which is between 15 and 25 liters per minute (1 pm), then an adjusted mean flow is calculated based on curve 290 . There is also a flat region 296 where the adjusted mean flow is clamped to a baseline value even if the actual mean flow is decreased. Thus, if the actual mean flow is less than 15 lpm, the adjusted mean flow is clamped at 20 lpm.
It is to be expressly understood that the specific shape of curve 290 and the delineations between the various regions is subject to variation. For example, although not illustrated, the present invention further contemplates providing this clamping feature if the mean flow exceeds a predetermined value, such as in region 298 .
A variable breathing number (VB#) is calculated as follows:
VB # = standard deviation adjusted mean flow . ( 1 )
The end result of the variable breathing detection process carried out by variable breathing detection module 270 is this variable breathing number. The higher the VB#, the more variable the weighted peak flow data.
The variable breathing number is provided by variable breathing detection module 270 to variable breathing monitoring module 272 , which compares this number to threshold values to determine when to request that variable breathing controller 274 take control from the auto-CPAP controller. FIG. 12 is a chart illustrating the hysteresis threshold criteria for declaring that the patient is experiencing variable breathing and, hence for requesting control of the pressure support system.
As shown in FIG. 12, an upper threshold 300 and a lower threshold 302 are set in advance. Preferably, the values of these thresholds are determined from empirical data. Variable breathing monitor 274 declares there to be variable breathing and issues a request for control to request processor 106 , when the variable breathing number (VB#), represented by line 304 , exceeds upper threshold 300 . This occurs at point 306 in FIG. 12. Variable breathing monitor 274 will continue to deem there to be variable breathing, and, hence, continue to request control, even if the VB# falls below upper threshold 300 . In short, a variable breathing active indication is turned on at point 306 and remains on over region 308 , until the VB# falls below lower threshold 302 at point 310 . While the variable breathing active indication is on, variable breathing monitor 274 issues a request for control of the pressure support from request processor 106 .
Similarly, variable breathing monitor 274 will continue to deem there to be no variable breathing, and, hence, will not request control, even if the VB# rises above lower threshold 302 . That is, the variable breathing active indication is turned off at point 310 and remains off over region 312 , until the VB# exceeds upper threshold 300 , which occurs at point 314 .
2. Variable Breathing Pressure Control
Once variable breathing controller 274 has been granted control of the pressure support system, it takes some initial action based on that action the auto-CPAP controller discussed below is taking. After this initial action, it performs an independent pressure control operation. FIG. 13 is a chart illustrating the pressure control operation of the variable breathing control module of the present invention.
As shown in FIG. 13, the pressure control operation performed by variable breathing controller 274 is subdivided into the following three regions: a) an active response region 320 , b) a pressure hold region 322 , and c) a slow ramp region 324 . The pressure control performed by variable breathing controller 274 in each of these regions is discussed in turn below. It is to be understood that even though there appears to be discontinuities in the delivered pressure in FIG. 13, this is only due to the manner in which each region is illustrated. In practice, the pressure at the end of region 320 is the start pressure for the pressure control that takes place in region 322 . Similarly, the pressure at the end of region 322 is the start pressure for the pressure control that takes place in region 324 .
In region 320 , column A illustrates the possible prior pressure curves, i.e., the possible pressure control actions being taken by the pressure support system before operation of the system was handed over to variable breathing controller 274 . Column B illustrates the corresponding pressure control curves that are produced by variable breathing controller 274 based on the prior curves. In case # 1 , a prior pressure 326 is flat (not increasing, not decreasing). In which case, variable breathing controller 274 will cause the pressure delivered to the patient to remain at this level, as indicated by pressure curve 328 .
In case # 2 , a prior pressure 330 is increasing. In which case, variable breathing controller 274 initially decreases the pressure delivered to the patient at a rate of 0.5 cmH 2 O per minute, as indicated by pressure curve 332 . The magnitude of the decrease is dependent on the magnitude of the increase in prior pressure 330 . Pressure decrease 332 is intended to erase the prior pressure increase 330 that possibly caused the variable breathing. However, the total decrease in pressure drop 332 is limited to 2 cmH 2 O. After pressure decrease 332 , variable breathing controller 274 holds the pressure steady, as indicated by pressure curve 334 .
In case # 3 , a prior pressure 336 is decreasing. In which case, the variable breathing controller initially increases the pressure delivered to the patient at a rate of 0.5 cmH 2 O per minute, as indicated by pressure curve 338 . The magnitude of the increase 338 is dependent on the magnitude of the decrease in prior pressure 336 . Pressure increase 338 is intended to erase the prior pressure decrease 336 that may have caused the variable breathing. However, the total increase in pressure 338 is limited to 2 cmH 2 O. After pressure increase 338 , variable breathing controller 274 holds the pressure steady, as indicated by pressure curve 340 .
In a presently preferred embodiment, the duration during which pressure is provided according to the paradigms discussed above for region 320 , column B, is set to 5 minutes. Thus, pressure curve 328 (case # 1 ) or curve 332 – 334 (case # 2 ), or curve 338 – 340 (case # 34 ) is provided for 5 minutes or until the variable breathing condition clears. Thereafter, the pressure is controlled according to the pressure operation of region 322 . It is to be understood, however, that this duration can be varied over a range of durations.
In region 322 , the pressure is either maintained at a constant value, as indicated by pressure curve 342 (case # 4 ), or it follows a decrease and hold pattern, as indicated by pressure curve 344 (case # 5 ). The decision to hold the pressure (case # 4 ) or to decrease the pressure (case # 5 ) is made by comparing the current pressure, i.e., the patient pressure at the end of region 320 , with the snore treatment pressure. This is similar to the pressure control operation of A/H controller 168 discussed above with respect to FIG. 9.
If there is no snore treatment pressure stored in the system, which will be the case if the snore controller has not been activated, the pressure is held constant as pressure curve 342 . If there is a snore treatment pressure, and if the current pressure is more than a predetermined amount above this snore treatment pressure, such as more than 2 cmH 2 O above the snore treatment pressure, variable breathing controller 274 decreases the pressure to a level that is a predetermined amount higher than the snore treatment pressure, as indicated by pressure curve 344 , and holds the pressure at the lower level, as indicated by line 346 , over the duration of region 322 . The present invention decreases the pressure during pressure decrease 344 to the snore treatment pressure, +1 cmH 2 O.
In a presently preferred embodiment, the duration during which pressure is provided according to the paradigms discussed above for region 322 is set to 15 minutes. Thus, pressure curve 342 (case # 4 ) or curve 344 – 346 (case # 5 ) is provided for 15 minutes or until the variable breathing condition clears. Thereafter, the pressure is controlled according to the pressure operation of region 324 . It is to be understood, however, that this 15 minute duration can be varied over a range of durations.
In region 324 , there is only one pressure control operation. Namely, the pressure delivered to the patient is slowly ramped down, as indicated by pressure curve 348 . This downward pressure ramp continues until the minimum system pressure is reached or until the variable breathing condition clears.
I presently view that extreme VB numbers, especially in excess, may reflect nonrestorative sleep. If so, the VB statistic may very well serve as a useful supplementary index for CompSAS patients attempting to methodically ascertain optimal fixed pressure(s).
I realize that the VB Control Layer cannot be invoked in CPAP modality. Regardless, I think Respironics collects the VB statistic in the SQL data structures just the same.

Re: Encore Analyzer Variable Breathing Poll
cinco777, did you make these figures using excel? Do you have a template or something like that to share? Thank you.cinco777 wrote:I posted the following to another thread, Re: (Another) Respironics Encore Data Failure, that Velbor started and I have been participating in. Since I may be at the low % end re experiencing Variable Breathing, I thought it might be useful for me to post my sample Night Events charts, with and without VB. I plan to look at my VB numbers, even though they may be very low (< 10% on average), to see if I can discern any information that may help me in my Sleep Apnea therapy. My postings to the forum thread mentioned above provides some background on the data analyses that I am doing and plan to do.
I created a MS Excel (2003) template for charting my nightly sleep events. The chart includes leak, snore, flow limitation, hypopnea, obstructive apnea, and non-responsive apnea (I've only experienced two and that was in early April). I've also created another template that adds Variable Breathing. I use the tables in the Encore Pro SQL database as input. I have color coded the events so they are visible on my display (1600x1200) and on printouts (Epson Inkjet). I am posting two sample charts. My next goal is to automate the process so I can create a Night Event chart in a few minutes each morning. A long term goal is to provide a "Zoom" capability when viewing the charts. My Variable Breathing %, as reported by the Encore Pro Analyzer, has averaged less than 10%/night the past month, with one night registering 1.5%. I plan to look at VB to see if it can tell me something, good or bad, about my sleep apnea therapy.