


Wow, what a great presentation. This graphic is really informative.
I don't want to switch topics but I have to ask after seeing this graphic. I use ResMed, including AutoScan 5.7 software. However it does not present this fine graphic nor any combination of graphics as good as this one. Does anyone know if the data output from ResMed could be used with this software?
It would seem somewhat unreasonable to think that manufacturers output compatible data streams from their respective machines. But, stranger things are have happened. So, I have to ask since this graphic is so very useful and informative.
Thanks.
Encore Analyzer Chart....Some suggestions please....
-
jskinner

- Posts: 1475
- Joined: Sat Aug 26, 2006 9:21 pm
- Location: Greenwich, Nova Scotia, Canada
- Contact:
Hmm, that is the latest version. I don't understand why your not seeing the date range on the graph. Is anyone else having this problem?jrfoster wrote: James, what is the newest version number? I am running 0.8.9.
-James
Encore Pro Analyzer Author
Facebook Apnea Group
Facebook Apnea Group
-
Sleepy-eyes
- Posts: 507
- Joined: Mon Nov 06, 2006 12:50 pm
- Location: Central Oklahoma
-
pastorgilbert

- Posts: 81
- Joined: Fri Feb 23, 2007 8:48 pm
- Location: Philadelphia, PA
- Contact:
-
jskinner
- Posts: 1475
- Joined: Sat Aug 26, 2006 9:21 pm
- Location: Greenwich, Nova Scotia, Canada
- Contact:
I'm a bit confused because that chart is not for a BiPAP. Are you sure you have your machine set to Bilevel mode? Bilevels have separate IPAP and EPAP charts.pastorgilbert wrote:Getting back to the original questions, Jim, any opinions on my chart?
-James
Encore Pro Analyzer Author
Facebook Apnea Group
Facebook Apnea Group
-
pastorgilbert
- Posts: 81
- Joined: Fri Feb 23, 2007 8:48 pm
- Location: Philadelphia, PA
- Contact:
Thanks for the comeback, Jim. The machine is set at Auto BiPap. It's an M-Series Respironics Auto Bi-Pap. This chart is one I took off your program based on info from the SmartCard. It's the Pressure vs AHI chart. Is there another that would be more helpful to you?
Thanks.
Pastorgilbert
Thanks.
Pastorgilbert
"May you breathe forever!"

First, a disclaimer. I base this on my own experience and charts and pretend to no special expertise here.
I find the pressure v. ahi charts interesting but not at all helpful in adjusting settings. I have managed to lower my AHI index down to about 0.3 as an average for the last week. But if you look at my pressure charts, you will find virtually all incidents at the highest pressure on my auto bipap - but of course that should happen since the machine is adjusting the pressure upwards to respond to the event. My time chart says I spend almost no time at that pressure, but that's where virtually all the events are.
The most useful tweak I implemented came from RG's suggestion that "the EPAP was the most crucial number to get right." Every few days or so, I bumped the EPAP pressure up, .5cm at a time. I started at 6 and found that 8 works optimally for me. I keep my IPAP pressure two digits higher than my pressure has ever ventured at its highest.
Many thanks to James for the Encore Pro Analyzer. It collects all the crucial data in one place and then gives you multiple ways to look at it.
"Be careful about reading health books. You may die of a misprint."
- Mark Twain
- Mark Twain
-
Guest
Okeydokey, Jim. I've now downloaded your latest version and due to cretans posting spam I'm not able to link to it for you. But it shows by AHI at its lowest point at 9 cm exhalation pressure and 11 cm inhalation pressure. I'm set at auto bipap 9cm and 12 cm. Do you have any further suggestions, Jim, or anybody else?
Thanks,
Pastorgilbert
Thanks,
Pastorgilbert
-
pastorgilbert
- Posts: 81
- Joined: Fri Feb 23, 2007 8:48 pm
- Location: Philadelphia, PA
- Contact:


-
pastorgilbert
- Posts: 81
- Joined: Fri Feb 23, 2007 8:48 pm
- Location: Philadelphia, PA
- Contact:
-
jskinner
- Posts: 1475
- Joined: Sat Aug 26, 2006 9:21 pm
- Location: Greenwich, Nova Scotia, Canada
- Contact:
One of the more experienced members should be able to give you some guidance. (One thing that I do notice is that you are looking at a fairly short date range. The longer the better.)Anonymous wrote:Do you have any further suggestions, Jim, or anybody else?
-james
Encore Pro Analyzer Author
Facebook Apnea Group
Facebook Apnea Group
-
jskinner
- Posts: 1475
- Joined: Sat Aug 26, 2006 9:21 pm
- Location: Greenwich, Nova Scotia, Canada
- Contact:
Sorry, it only works with Respironics machines.oldvaham wrote:Does anyone know if the data output from ResMed could be used with this software?
Encore Pro Analyzer Author
Facebook Apnea Group
Facebook Apnea Group

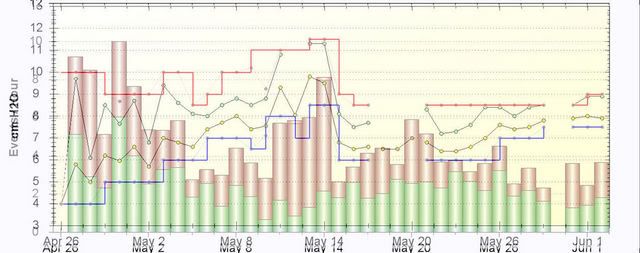
James, I'm not sure what you meant by this, so I downloaded the latest copy. I was thinking maybe it had something like this chart, which I cobbled together by using photo editing software. What I was trying to see was a night by night acount of how pressure affected my AHI. I thought maybe the higher pressures were generating centrals for me (it looks like they do).jskinner wrote:Hmm, that is the latest version. I don't understand why your not seeing the date range on the graph. Is anyone else having this problem?jrfoster wrote: James, what is the newest version number? I am running 0.8.9.
-James
Obviously the chart leaves a lot to be desired, but it does relate my pressure to AHI for each date. If you meant something like this, I couldn't find it. If not, might you consider doing something like this in the future? Anyway. here's superimposed images.
- Rose
Thread on how I overcame aerophagia
http://www.cpaptalk.com/viewtopic/t3383 ... hagia.html
Thread on my TAP III experience
http://www.cpaptalk.com/viewtopic/t3705 ... ges--.html
Thread on how I overcame aerophagia
http://www.cpaptalk.com/viewtopic/t3383 ... hagia.html
Thread on my TAP III experience
http://www.cpaptalk.com/viewtopic/t3705 ... ges--.html
Rosemary - Am I right in reading your chart to suggest that your have adjusted your max pressures for EPAP and IPAP up and down in large ways every few days? If so, I would suggest you start by moving your EPAP up to meet the 90 percent line and leave the rest untouched. Check your data after five days to a week.
If necessary, lather, rinse, repeat - but adjust only one metric at a time and wait to see its results over time.
If necessary, lather, rinse, repeat - but adjust only one metric at a time and wait to see its results over time.
"Be careful about reading health books. You may die of a misprint."
- Mark Twain
- Mark Twain
Hi Morpheus, I use an auto, not a bipap, so the pressure changes you see are the upper and lower pressures for the auto. (I've begun trying the autopap changes for about 5 days, too, but early on I just had to experiment).Morpheus wrote:Rosemary - Am I right in reading your chart to suggest that your have adjusted your max pressures for EPAP and IPAP up and down in large ways every few days? If so, I would suggest you start by moving your EPAP up to meet the 90 percent line and leave the rest untouched. Check your data after five days to a week.
If necessary, lather, rinse, repeat - but adjust only one metric at a time and wait to see its results over time.
I didn't mean to confuse the intent of this post, I just wanted to find out if what jskinner was talking about with dates was similar to the example I gave.
- Rose
Thread on how I overcame aerophagia
http://www.cpaptalk.com/viewtopic/t3383 ... hagia.html
Thread on my TAP III experience
http://www.cpaptalk.com/viewtopic/t3705 ... ges--.html
Thread on how I overcame aerophagia
http://www.cpaptalk.com/viewtopic/t3383 ... hagia.html
Thread on my TAP III experience
http://www.cpaptalk.com/viewtopic/t3705 ... ges--.html