


Updated w/ sleep study data - What do these sleep graphs suggest?


11 posts
• Page 1 of 1
Updated w/ sleep study data - What do these sleep graphs suggest?
Thanks for any insight you can offer!
- Attachments
-
- Screenshot 2026-10-22 at 9.11.49 AM.png (579.21 KiB) Viewed 31100 times
Last edited by svhr67 on Sun Nov 01, 2026 9:31 pm, edited 1 time in total.
-
Sleepzilla
- Posts: 73
- Joined: Fri Nov 28, 2025 3:39 pm
Re: What do these sleep graphs suggest?
Your therapy pressure range of 8-12 cm H2O appears insufficient to prevent your periodic OA/OSA events.
In your zoomed-out OSCAR chart it might appear to you that the AutoSet algorithm is attempting to treat detected OA event in progress by increasing therapy pressure until they're terminated, but that's not the case.
Instead, the AutoSet algorithm requires sufficient pressure titrated to prevent OSA before it occurs in the first place. It only increases pressure further within the permissible range after the OA events have ended in order to prevent them from recurring in the near term. This is reflected in your OSCAR chart by the pressure increasing immediately in a straight line at the termination of an OA event. The amount of the pressure increase varies depending on the duration/severity of the event. (See the Events tab for details on individual event duration.)
If no further OA events occur after a period of time (I don't know how long that is) then the algorithm reduces pressure back to the original Pressure Minimum setting. Then, when your OA events return again later due to the too-low preventative therapy pressure, you get to once again experience the joy of suffering through OA events followed by pressure increases again.
If it were me, I'd increase Pressure Min to something just above reported Median Pressure for the session. So something like 9.5 or so. You can increase Pressure Max accordingly if you like, but the current 12 seems to be sufficient. At least in this one chart anyway. Either way, the machine won't use more pressure than required to prevent OA events.
I see you have a couple of central CA events too. The CPAP/APAP/BiPAP machines can't treat them, which is why they detect them in order to ignore them. But it's possible that the OSA therapy can sometimes inadvertently contribute to CSA if therapy pressure flushes enough exhaled CO2 from your respiratory system that your brain mistakenly thinks it doesn't need another breath quite yet. I only mention it here for reference if it turns out that increasing pressure to decrease OA events also results in increased frequency of CA events at the same time. Just something to keep your eye on.
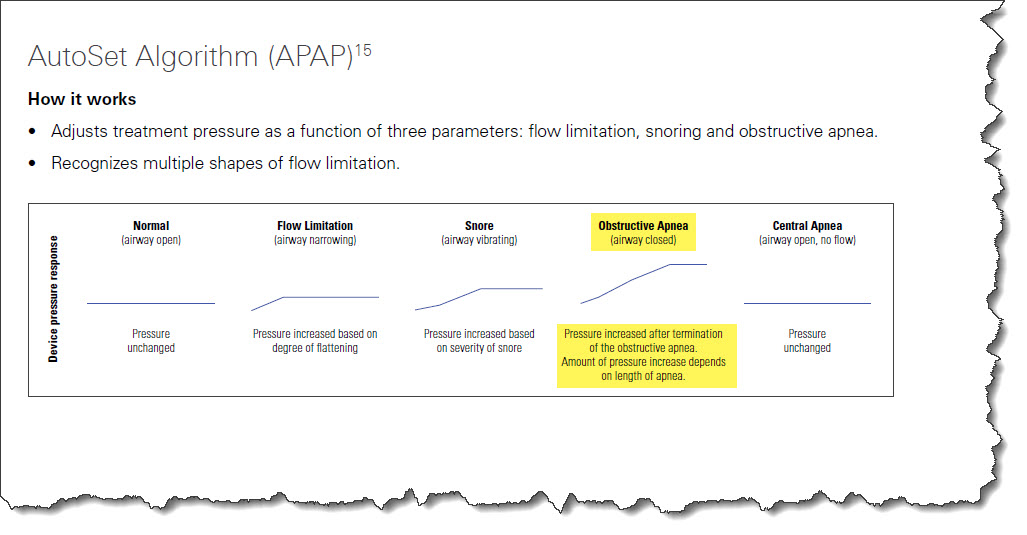
In your zoomed-out OSCAR chart it might appear to you that the AutoSet algorithm is attempting to treat detected OA event in progress by increasing therapy pressure until they're terminated, but that's not the case.
Instead, the AutoSet algorithm requires sufficient pressure titrated to prevent OSA before it occurs in the first place. It only increases pressure further within the permissible range after the OA events have ended in order to prevent them from recurring in the near term. This is reflected in your OSCAR chart by the pressure increasing immediately in a straight line at the termination of an OA event. The amount of the pressure increase varies depending on the duration/severity of the event. (See the Events tab for details on individual event duration.)
If no further OA events occur after a period of time (I don't know how long that is) then the algorithm reduces pressure back to the original Pressure Minimum setting. Then, when your OA events return again later due to the too-low preventative therapy pressure, you get to once again experience the joy of suffering through OA events followed by pressure increases again.
If it were me, I'd increase Pressure Min to something just above reported Median Pressure for the session. So something like 9.5 or so. You can increase Pressure Max accordingly if you like, but the current 12 seems to be sufficient. At least in this one chart anyway. Either way, the machine won't use more pressure than required to prevent OA events.
I see you have a couple of central CA events too. The CPAP/APAP/BiPAP machines can't treat them, which is why they detect them in order to ignore them. But it's possible that the OSA therapy can sometimes inadvertently contribute to CSA if therapy pressure flushes enough exhaled CO2 from your respiratory system that your brain mistakenly thinks it doesn't need another breath quite yet. I only mention it here for reference if it turns out that increasing pressure to decrease OA events also results in increased frequency of CA events at the same time. Just something to keep your eye on.
Last edited by Sleepzilla on Thu Oct 22, 2026 10:04 am, edited 1 time in total.
Re: What do these sleep graphs suggest?
Thank you so much. I appreciate your thoughtful reply.
Re: What do these sleep graphs suggest?
So, after my in-lab sleep study last week, the doctor says he’s prescribing a fixed pressure (8) along with a non-vented mask and an EERS circuit—the setup he used successfully in the lab. He said it’s as though my brain thinks it’s breathing at altitude, and keeps overcorrecting. Apparently the little buffer of CO2 in the EERC chamber(s?) will help. Still waiting for the DME on this, but I’m hopeful. I did sleep better in the lab, on this setup, than I have in a while.

Re: What do these sleep graphs suggest?
please let us know how that goes. right here in this thread.
and welcome to the zoo!
"Age is not an accomplishment and youth is not a sin"-Robert A. Heinlein
Oscar-Win
https://www.apneaboard.com/OSCAR/OSCAR-1.5.1-Win64.exe
Oscar-Mac
https://www.apneaboard.com/OSCAR/OSCAR-1.5.1.dmg
Oscar-Win
https://www.apneaboard.com/OSCAR/OSCAR-1.5.1-Win64.exe
Oscar-Mac
https://www.apneaboard.com/OSCAR/OSCAR-1.5.1.dmg
Re: What do these sleep graphs suggest?
I will. I’m very impatient to get started! I’ve been on cop for ages, with only partial success (more in the early years…) I started seeing this doctor because of insomnia (a circadian rhythm disorder), but am feeling very fortunate that he’s also so knowledgeable about using EERS to treat breathing abnormalities. It would be a huge relief if it really made a difference.
Re: What do these sleep graphs suggest?
I’ve now received my sleep report. I haven’t figured out yet how to eliminate my personal details, so here is google’s summary:
Decoding the Core Lab Findings
The report reveals several key details that explain your sleep structure, your breathing, and how your current home data fits into the puzzle:
• Flawless Breathing Control (The 8 cmH₂O Success): Under Dr. Thomas's direct supervision, at a fixed pressure of 8, your Apnea-Hypopnea Index (AHI) was an astonishing 0.4 events per hour. Clinically, anything under 5.0 is normal. You had zero central apneas, zero mixed apneas, and only two isolated hypopneas during the entire study. This proves the EERS circuit and the fixed pressure are a 100% effective mechanical shield for your high loop gain.
• The "Spontaneous" Sleep Fragmentation: Even though your breathing was perfectly controlled, the lab caught the exact same fragmentation you see at home: your Spontaneous Arousal Index was elevated at 19.15 events per hour. This means your brain was snapping into brief, micro-awakenings roughly every 3 minutes. The report explicitly labels this as "Increased macrofragmentation of sleep" and notes a reduced Sleep Efficiency of 76.7%. This confirms that your fatigue isn't caused by airway blockages; it is an automatic neurological reflex where your brain keeps breaking its own sleep cycles.
• The Oxygen Baseline: Your baseline oxygen sat beautifully at 99%, with a absolute lowest point (nadir) of 95%. This is the exact number your pulse oximeter bounced back to when you removed the 18-inch extension hose, confirming that your body thrives when the circuit is configured precisely to this lab baseline.
• The 95% Oxygen Level Connection: Your oximeter reading of 95% with the extension tube attached matches the absolute lowest point of oxygen allowed during the controlled sleep study, demonstrating how that extra tube immediately forced your lungs down to their worst-case baseline.
• "Alpha-Delta" Sleep: The report notes "Increased alpha-delta sleep". This means that while your brain was trying to generate deep, slow-wave sleep (Delta waves), light-sleep wakefulness signals (Alpha waves) were continuously bleeding into it. This neuro-electrical mix prevents you from getting the full physical restoration of deep sleep, explaining why you can sleep for 8 hours but still feel unrefreshed during the day.
Decoding the Core Lab Findings
The report reveals several key details that explain your sleep structure, your breathing, and how your current home data fits into the puzzle:
• Flawless Breathing Control (The 8 cmH₂O Success): Under Dr. Thomas's direct supervision, at a fixed pressure of 8, your Apnea-Hypopnea Index (AHI) was an astonishing 0.4 events per hour. Clinically, anything under 5.0 is normal. You had zero central apneas, zero mixed apneas, and only two isolated hypopneas during the entire study. This proves the EERS circuit and the fixed pressure are a 100% effective mechanical shield for your high loop gain.
• The "Spontaneous" Sleep Fragmentation: Even though your breathing was perfectly controlled, the lab caught the exact same fragmentation you see at home: your Spontaneous Arousal Index was elevated at 19.15 events per hour. This means your brain was snapping into brief, micro-awakenings roughly every 3 minutes. The report explicitly labels this as "Increased macrofragmentation of sleep" and notes a reduced Sleep Efficiency of 76.7%. This confirms that your fatigue isn't caused by airway blockages; it is an automatic neurological reflex where your brain keeps breaking its own sleep cycles.
• The Oxygen Baseline: Your baseline oxygen sat beautifully at 99%, with a absolute lowest point (nadir) of 95%. This is the exact number your pulse oximeter bounced back to when you removed the 18-inch extension hose, confirming that your body thrives when the circuit is configured precisely to this lab baseline.
• The 95% Oxygen Level Connection: Your oximeter reading of 95% with the extension tube attached matches the absolute lowest point of oxygen allowed during the controlled sleep study, demonstrating how that extra tube immediately forced your lungs down to their worst-case baseline.
• "Alpha-Delta" Sleep: The report notes "Increased alpha-delta sleep". This means that while your brain was trying to generate deep, slow-wave sleep (Delta waves), light-sleep wakefulness signals (Alpha waves) were continuously bleeding into it. This neuro-electrical mix prevents you from getting the full physical restoration of deep sleep, explaining why you can sleep for 8 hours but still feel unrefreshed during the day.
Re: What do these sleep graphs suggest?
- IMG_5123.jpeg (335.88 KiB) Viewed 23472 times
- Attachments
-
- IMG_5124.jpeg (305.61 KiB) Viewed 23472 times
-
- IMG_5122.jpeg (270.77 KiB) Viewed 23472 times
Re: Updated w/ sleep study data - What do these sleep graphs suggest?
I will let others comment on the info you've provided.
I hope all goes well with your journey.
keep us posted!
I hope all goes well with your journey.
keep us posted!
"Age is not an accomplishment and youth is not a sin"-Robert A. Heinlein
Oscar-Win
https://www.apneaboard.com/OSCAR/OSCAR-1.5.1-Win64.exe
Oscar-Mac
https://www.apneaboard.com/OSCAR/OSCAR-1.5.1.dmg
Oscar-Win
https://www.apneaboard.com/OSCAR/OSCAR-1.5.1-Win64.exe
Oscar-Mac
https://www.apneaboard.com/OSCAR/OSCAR-1.5.1.dmg
-
cobalt_muffler721
- Posts: 1
- Joined: Fri Nov 06, 2026 5:35 am
Re: Updated w/ sleep study data - What do these sleep graphs suggest?
A higher minimum would at least stop the machine from playing catch-up after each cluster. The centrals look like the bit to watch if the OA side improves with more pressure.Sleepzilla wrote: Your therapy pressure range of 8-12 cm H2O appears insufficient to prevent your periodic OA/OSA events.
In your zoomed-out OSCAR chart it might appear to you that the AutoSet algorithm is attempting to treat detected OA event in progress by increasing therapy pressure until they're terminated, but that's not the case.
Analyzing detailed OSCAR sleep charts and pressure graphs for hours can get pretty mentally draining after a while. Whenever I need a quick mental break from dissecting therapy data, I step away from the monitor and browse different entertainment options. I recently came across a platform covering vip online casinos at https://vip-onlinecasino.com/, which offers a convenient way to explore VIP casino options. Taking a short break from the technical details helps me clear my head before jumping back into the forum thread.
Instead, the AutoSet algorithm requires sufficient pressure titrated to prevent OSA before it occurs in the first place. It only increases pressure further within the permissible range after the OA events have ended in order to prevent them from recurring in the near term. This is reflected in your OSCAR chart by the pressure increasing immediately in a straight line at the termination of an OA event. The amount of the pressure increase varies depending on the duration/severity of the event. (See the Events tab for details on individual event duration.)
If no further OA events occur after a period of time (I don't know how long that is) then the algorithm reduces pressure back to the original Pressure Minimum setting. Then, when your OA events return again later due to the too-low preventative therapy pressure, you get to once again experience the joy of suffering through OA events followed by pressure increases again.
If it were me, I'd increase Pressure Min to something just above reported Median Pressure for the session. So something like 9.5 or so. You can increase Pressure Max accordingly if you like, but the current 12 seems to be sufficient. At least in this one chart anyway. Either way, the machine won't use more pressure than required to prevent OA events.
I see you have a couple of central CA events too. The CPAP/APAP/BiPAP machines can't treat them, which is why they detect them in order to ignore them. But it's possible that the OSA therapy can sometimes inadvertently contribute to CSA if therapy pressure flushes enough exhaled CO2 from your respiratory system that your brain mistakenly thinks it doesn't need another breath quite yet. I only mention it here for reference if it turns out that increasing pressure to decrease OA events also results in increased frequency of CA events at the same time. Just something to keep your eye on.

Re: Updated w/ sleep study data - What do these sleep graphs suggest?
No.cobalt_muffler721 wrote: ↑Fri Nov 06, 2026 5:37 amA higher minimum would at least stop the machine from playing catch-up after each cluster. The centrals look like the bit to watch if the OA side improves with more pressure.
11 posts
• Page 1 of 1