


I am experiencing annoying air leaks from my F&P Eson mask. What’s annoying is that the leak is usually in the direction of one or the other of my eyes.
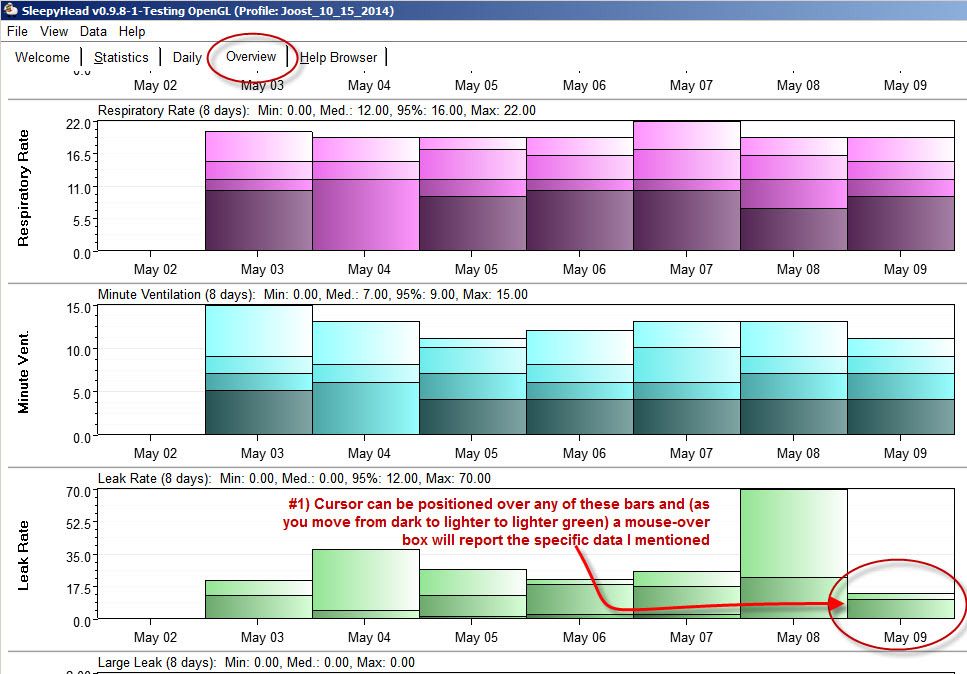
I checked with Sleepyhead which reported ("95% Leak"/"Max") the following figures: May 3 – (95% leak 12/max 20); May 4 – (4/37), May 5 – (12/26), May 6 – (18/21), May 7 – (17/25), May 8 – (22/70), May 9 – (10/13).
Those figures represent the daily “Overview View” bar chart data when I inspected results over a period of time (May 3 – May 9).
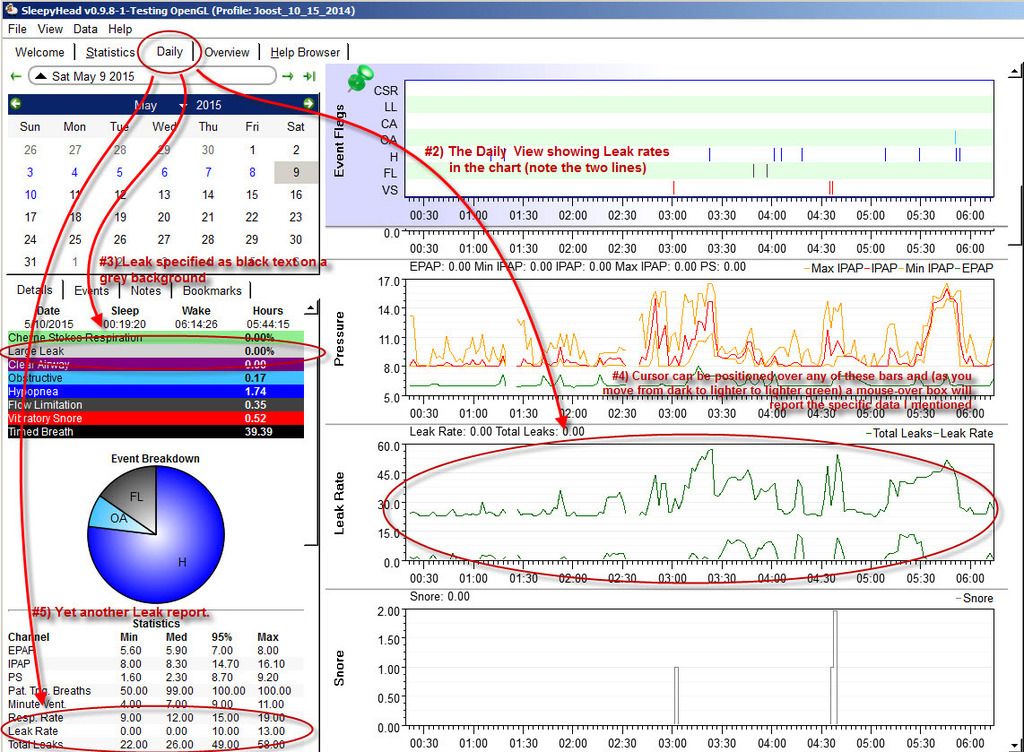
However, if I view the same data in “Daily View” (for May 9) the Large Leak (Bold black text on grey background) is listed as 0.00% and the charted rate is an over-time double set of spiked horizontal lines (lower from 0 to 13.8; upper from 27.4 to 50);
What do these four (bar chart; left column (daily) text; (daily) double line chart) readings mean and how do they relate to each other?
Leak Data

Re: Leak Data
Can you post the image of the data you are looking at? It will be much easier for us to explain what the data means if we can see the actual data you are looking at.AfibApnea wrote: What do these four (bar chart; left column (daily) text; (daily) double line chart) readings mean and how do they relate to each other?
_________________
| Machine: DreamStation BiPAP® Auto Machine |
| Mask: Swift™ FX Nasal Pillow CPAP Mask with Headgear |
| Additional Comments: PR System DreamStation and Humidifier. Max IPAP = 9, Min EPAP=4, Rise time setting = 3, minPS = 3, maxPS=5 |
Re: Leak Data
I'm not asking about a particular set of data, just what the data listings mean and how they relate to each other.
The "0.00" figure comes from the (Black text w. grey background) items listed above the pie chart in Sleepyhead daily view.
The line charts look like two sets of mountains and valleys and appear in the daily chart set on the right side of the screen labeled "Leak Rate".
The "95% leak" and "max" figures appear as you mouse over each of the (Overview) bars in the chart labeled "Leak Rate".
The only thing one needs to know is Sleepyhead's Daily and Overview modes.
ResMed Air Curve 10 ASV w. humidifier
PR S1 REMstar 60 Series BiPAP ASV Advanced & PR S1 with humidifier
Various Nasal masks or Nasal pillows
Software:
PR S1 REMstar 60 Series BiPAP ASV Advanced & PR S1 with humidifier
Various Nasal masks or Nasal pillows
Software:
Re: Leak Data
Seems to me you asked for help - and Roby Sue offered it, but felt she needed the graphs to be able to help the best way she knows how to... why not just post a couple of graphs to give her something to work with?
Re: Leak Data
Roby Sue has always been a big help to me (both responding to my posts and to others) and I mean no offense in my reply.
The reason I don't want to post pics is because I would have to post multiple images (the full Daily screen; the Overview screen graph with a mouse-over - which is no mean trick) and because the process is complicated, time consuming and unnecessary.
My apologies if anyone took offense.
The reason I don't want to post pics is because I would have to post multiple images (the full Daily screen; the Overview screen graph with a mouse-over - which is no mean trick) and because the process is complicated, time consuming and unnecessary.
My apologies if anyone took offense.
ResMed Air Curve 10 ASV w. humidifier
PR S1 REMstar 60 Series BiPAP ASV Advanced & PR S1 with humidifier
Various Nasal masks or Nasal pillows
Software:
PR S1 REMstar 60 Series BiPAP ASV Advanced & PR S1 with humidifier
Various Nasal masks or Nasal pillows
Software:
Re: Leak Data
The problem is: Without seeing the screen shots of what you are talking about, I can't figure out what you are talking about. And so I can't answer your questions.AfibApnea wrote:Roby Sue has always been a big help to me (both responding to my posts and to others) and I mean no offense in my reply.
The reason I don't want to post pics is because I would have to post multiple images (the full Daily screen; the Overview screen graph with a mouse-over - which is no mean trick) and because the process is complicated, time consuming and unnecessary.
My apologies if anyone took offense.
There is stuff that I wrote over at apneaboard.com that explains a lot of what's presented in SleepyHead and how it looks---i.e. I took a lot of screen shots to try to sort out how to tell interested newbies what everything means. Perhaps you can find the answers to your questions over there. Or perhaps not, since that stuff was written when SH 0.9.4 was the latest version of SH.
Here's the thing: You write
And I am clueless about which bar chart data you're talking about in the Overview view, which data you're talking about in the Daily view, which numbers you are referring to when you talk about "Large Leak", and thoroughly lost over what the heck you mean by "an over-time double set of spiked horizontal lines".Those figures represent the daily “Overview View” bar chart data when I inspected results over a period of time (May 3 – May 9).
However, if I view the same data in “Daily View” (for May 9) the Large Leak (Bold black text on grey background) is listed as 0.00% and the charted rate is an over-time double set of spiked horizontal lines (lower from 0 to 13.8; upper from 27.4 to 50);
What do these four (bar chart; left column (daily) text; (daily) double line chart) readings mean and how do they relate to each other?
I can make some guesses, but I'd rather not waste my time guessing about what you are interested in and putting together multiple screen shots that illustrate what I hope you are talking about so I can ask, Is this what you are talking about?
In other words, I don't mind spending time answering questions in a very thorough and methodical fashion. But I also expect that if someone is asking very technical questions (like yours), they should take the time to post some screen shots that make it clear exactly what their questions are.
I don't mean to sound harsh, but in order to get your questions answered, somebody's got to spend the time making the screen shots so that what we're talking about is actually clear to everybody in the conversation. Since they're your questions, I think you should post some screen shots for me to look at.
In all seriousness, I suspect that you need a grand total of two screen shots. One of the Overview View with the graphs of interest visible. (Turn the graphs you aren't interested in OFF.) And a Second screen shot of the Daily Data window showing the part of the left side bar that you're asking about along with the Daily graphs that you are talking about. Again, turn off the graphs you're not interested in and turn off the pie chart on the left side bar so that more of the left side bar is visible. (Heck, minimize the calendar while you are at it.)
_________________
| Machine: DreamStation BiPAP® Auto Machine |
| Mask: Swift™ FX Nasal Pillow CPAP Mask with Headgear |
| Additional Comments: PR System DreamStation and Humidifier. Max IPAP = 9, Min EPAP=4, Rise time setting = 3, minPS = 3, maxPS=5 |
Re: Leak Data
Thank you for forcing me to upload the photos (although the PhotoBucket process is really tedious). While taking the screenshots I noticed yet another Leak Rate instance.
Overview screen:
Daily screen:
I've numbered all the instances (1-5). What I want to know is how each relates to the others.
Overview screen:
Daily screen:
I've numbered all the instances (1-5). What I want to know is how each relates to the others.
ResMed Air Curve 10 ASV w. humidifier
PR S1 REMstar 60 Series BiPAP ASV Advanced & PR S1 with humidifier
Various Nasal masks or Nasal pillows
Software:
PR S1 REMstar 60 Series BiPAP ASV Advanced & PR S1 with humidifier
Various Nasal masks or Nasal pillows
Software:

Re: Leak Data
it's really not difficult to post pics, sleepyhead has a f12 hotkey which works as long as your OS hasn't stolen that away for something else, and imgur makes it easy to post.AfibApnea wrote:Roby Sue has always been a big help to me (both responding to my posts and to others) and I mean no offense in my reply.
The reason I don't want to post pics is because I would have to post multiple images (the full Daily screen; the Overview screen graph with a mouse-over - which is no mean trick) and because the process is complicated, time consuming and unnecessary.
My apologies if anyone took offense.
https://sleep.tnet.com/resources/sleepyhead/shorganize
Get OSCAR
Accounts to put on the foe list: dataq1, clownbell, gearchange, lynninnj, mper!?, DreamDiver, Geer1, almostadoctor, sleepgeek, ajack, stom, mogy, D.H., They often post misleading, timewasting stuff.
Accounts to put on the foe list: dataq1, clownbell, gearchange, lynninnj, mper!?, DreamDiver, Geer1, almostadoctor, sleepgeek, ajack, stom, mogy, D.H., They often post misleading, timewasting stuff.
Re: Leak Data
AfibApnea,
Thanks for the screen shots. I think I can now answer most (possibly all) of your questions.
First: You are using a PR System One of some sort, and that does affect the answers to some of your questions. I'll stick with what's happening on your machine.
Let's look at the detailed data first:
Item #3: The Large Leak % shown in the Left Side bar is nothing more than the Percent of the night spent in Official Large Leak territory. When this number is 0.0%, that means your machine detected NO Official Large Leaks during the night. That's good. But here's the thing about PR machines: PR never officially defines a Large Leak. The "fuzzy line" for declaring something is a Large Leak depends on the pressure you are using and also whether you have a Series 50 or Series 60 machine. The Series 60 machines seem to be a bit more likely to score Large Leaks. Large Leaks are flagged in the event table at the top of the daily graphs and they are also flagged as gray backgrounds on the flow rate graph and on the Leak Rate graphs. You can sometimes use that information to get an idea of where the PR machine is drawing the Official Large Leak data by zooming in on the appropriate part of the detailed data and looking carefully at the Leak curves.
Item #2: The Leak Graphs. There are two curves shown for the leak data on a PR machine.
Connections between the various pieces of Leak Data
The Large Leak % data in Item #3 shows up as the amount of gray backgrounds in the Flow Rate graph and the Leak Graphs in the Daily Detail graphs (Item #2). Technically speaking: The Large Leak % is computed as:
Because PR never defines an Official Large Leak in terms of L/min, there is no direct connection between the numerical data in Item #5 and the Large Leak % data in Item #3. However, if the Large Leak % is greater than 5%, then we can conclude that the 95% Total Leak Rate is high enough for the machine to consider it an Official Large Leak. Likewise, if the Large Leak % equals 0.0 and there's no gray background shading on the Flow Rate and Leak Rate graphs, then it's safe to conclude that on this night your Maximum Total Leak Rate was low enough for the machine to NOT score an official Large Leak.
The connections between the data in Item #5 and the Leak Rate Graphs in Item #2 is pretty straightforward:
On each day in the Overview Screen, the bar for that day gives a visual representation of the Median, 95%, and Maximum statistical data for that particular day. Since you're inquiring about Leak data, we'll focus our attention on that line.
Item #1: Technically speaking each Green bar in the Overview Leak Rate is broken into a Dark Green chunk (at the bottom), a Medium Green chunk (in the middle) and a Light Green chunk (at the top). Each of these pieces of the bar for a given day correspond to the median, 95%, and maximum (approximate excess) Leak Data that shows up in the Left Side Bar of the Daily Detailed Data---the part of the Daily Details that you labeled as Item #5. The correspondence is:
When you do a Shift-click when the mouse is on top of one of these Green Bars, the view will change to the Daily Detailed Data for the date you just selected. In other words, doing a Shift-click takes you directly to the Daily Detailed Data for the date you just selected. The numbers in the pop up box that had been shown in the Overview graph are now showing up in the left side bar under the statistical data.
Thanks for the screen shots. I think I can now answer most (possibly all) of your questions.
First: You are using a PR System One of some sort, and that does affect the answers to some of your questions. I'll stick with what's happening on your machine.
Let's look at the detailed data first:
Item #3: The Large Leak % shown in the Left Side bar is nothing more than the Percent of the night spent in Official Large Leak territory. When this number is 0.0%, that means your machine detected NO Official Large Leaks during the night. That's good. But here's the thing about PR machines: PR never officially defines a Large Leak. The "fuzzy line" for declaring something is a Large Leak depends on the pressure you are using and also whether you have a Series 50 or Series 60 machine. The Series 60 machines seem to be a bit more likely to score Large Leaks. Large Leaks are flagged in the event table at the top of the daily graphs and they are also flagged as gray backgrounds on the flow rate graph and on the Leak Rate graphs. You can sometimes use that information to get an idea of where the PR machine is drawing the Official Large Leak data by zooming in on the appropriate part of the detailed data and looking carefully at the Leak curves.
Item #2: The Leak Graphs. There are two curves shown for the leak data on a PR machine.
- The top curve is the Total Leak Rate as recorded by the machine. This data is sampled at some kind of an interval. The Total Leak Rate is the rate the air is being "lost" in the semi-closed pressurized system comprising the machine, the hose, the mask, and your upper airway. The Total Leak Rate includes the intentional leak rate built into the mask to prevent rebreathing CO2 as well as any excess leak caused by mouth breathing and mask leaks. Ideally this curve should be relatively flat and near the published intentional leak rate for your mask at your pressure.
- The bottom curve is SleepyHead's Approximate Excess Leak Rate. SleepyHead does a statistical analysis to determine what is likely the intentional leaking for the mask you use at the pressure you use as reflected in actual usage. At one point I knew some of the details of how JediMark chose to compute the approximate intentional leak rate from the Total Leak Rate data. If you subtract the computed approximate intentional leak rate from the Total Leak Rate, you get the Approximate Excess Leak Rate. Ideally this curve should be down around the 0.0 L/min line.
- The two curves are parallel because the bottom one is computed by subtracting off the computed approximate intentional leak rate from the top curve.
Connections between the various pieces of Leak Data
The Large Leak % data in Item #3 shows up as the amount of gray backgrounds in the Flow Rate graph and the Leak Graphs in the Daily Detail graphs (Item #2). Technically speaking: The Large Leak % is computed as:
- Large Leak % = [(total time with gray backgrounds)/(total run time)] x 100%
Because PR never defines an Official Large Leak in terms of L/min, there is no direct connection between the numerical data in Item #5 and the Large Leak % data in Item #3. However, if the Large Leak % is greater than 5%, then we can conclude that the 95% Total Leak Rate is high enough for the machine to consider it an Official Large Leak. Likewise, if the Large Leak % equals 0.0 and there's no gray background shading on the Flow Rate and Leak Rate graphs, then it's safe to conclude that on this night your Maximum Total Leak Rate was low enough for the machine to NOT score an official Large Leak.
The connections between the data in Item #5 and the Leak Rate Graphs in Item #2 is pretty straightforward:
- The minimum and maximum Total Leak Rate numbers are the y-coordinates of lowest and highest points on the Total Leak Rate graph.
- If you drew a horizontal line at the median Total Leak Rate, the Total Leak Rate curve would be AT or BELOW that line for 50% of the time the machine was running, and the Total Leak Rate curve would be AT or ABOVE that line for 50% of the time the machine was running.
- If you drew a horizontal line at the 95% Total Leak Rate, the Total Leak Rate curve would be AT or BELOW that line for 95% of the time the machine was running, and the Total Leak Rate curve would be AT or ABOVE that line for 5% of the time the machine was running.
On each day in the Overview Screen, the bar for that day gives a visual representation of the Median, 95%, and Maximum statistical data for that particular day. Since you're inquiring about Leak data, we'll focus our attention on that line.
Item #1: Technically speaking each Green bar in the Overview Leak Rate is broken into a Dark Green chunk (at the bottom), a Medium Green chunk (in the middle) and a Light Green chunk (at the top). Each of these pieces of the bar for a given day correspond to the median, 95%, and maximum (approximate excess) Leak Data that shows up in the Left Side Bar of the Daily Detailed Data---the part of the Daily Details that you labeled as Item #5. The correspondence is:
- Top of the Dark Green Bar = Median Leak Rate Data in item #5
- Top of the Medium Green Bar = 95% Leak Rate Data in item #5
- Top of the Light Green Bar = Maximum Rate Leak Data in item #5
When you do a Shift-click when the mouse is on top of one of these Green Bars, the view will change to the Daily Detailed Data for the date you just selected. In other words, doing a Shift-click takes you directly to the Daily Detailed Data for the date you just selected. The numbers in the pop up box that had been shown in the Overview graph are now showing up in the left side bar under the statistical data.
_________________
| Machine: DreamStation BiPAP® Auto Machine |
| Mask: Swift™ FX Nasal Pillow CPAP Mask with Headgear |
| Additional Comments: PR System DreamStation and Humidifier. Max IPAP = 9, Min EPAP=4, Rise time setting = 3, minPS = 3, maxPS=5 |
Re: Leak Data
Wow, what a reply!
And I was asking this question because I wanted to know whether to report to my RT that--according to the data--my mask was leaking. I was wondering if, given months of use, the rubber on the nasal mask changes (becomes less supple?) thus causing the annoying leaks. On the other hand, it could be that I'm getting older.
How did you know I was using a PR System One REMstar Bipap Auto SV Advanced device? Before posting this topic I'd gone into my Profile and updated my equipment list, but I still don't see it on any of my posts. Does the post sender not get to see this information?
ResMed Air Curve 10 ASV w. humidifier
PR S1 REMstar 60 Series BiPAP ASV Advanced & PR S1 with humidifier
Various Nasal masks or Nasal pillows
Software:
PR S1 REMstar 60 Series BiPAP ASV Advanced & PR S1 with humidifier
Various Nasal masks or Nasal pillows
Software:

Re: Leak Data
You may have chosen a machine that has been discontinued and those links are broken.
What is the model number of your machine? If it is the 950 PR System One Bipap Auto SV Advanced then that link is broken and if you chose it then it isn't showing up because the link is broken.
If it is a 960 model then it is a 60 Series machine and that link is still active...PR system one 60 series BIPap Auto SV Advanced.
If unsure about the exact model number just look on the bottom of the blower unit for a 3 digit number which may have DS, REF or P in front or behind it.
If it is the 950 that you are using just add it in your comments section of the equipment profile since the link is broken.
_________________
| Machine: AirCurve™ 10 VAuto BiLevel Machine with HumidAir™ Heated Humidifier |
| Additional Comments: Mask Bleep Eclipse https://bleepsleep.com/the-eclipse/ |
I may have to RISE but I refuse to SHINE.
Re: Leak Data
the pressure chart gives it away for me.AfibApnea wrote:How did you know I was using a PR System One REMstar Bipap Auto SV Advanced device? Before posting this topic I'd gone into my Profile and updated my equipment list, but I still don't see it on any of my posts. Does the post sender not get to see this information?
and, no, your equipment isn't showing up, you've either selected the wrong one off the list, or the link is broken, and you need to pick a different one.
if you've got a 950, it's PR System One REMstar BiPAP Auto SV Advanced
if it's a 960 you've got: PR System One REMStar 60 Series BiPAP autoSV Advanced
either way, your mask should show up.
Get OSCAR
Accounts to put on the foe list: dataq1, clownbell, gearchange, lynninnj, mper!?, DreamDiver, Geer1, almostadoctor, sleepgeek, ajack, stom, mogy, D.H., They often post misleading, timewasting stuff.
Accounts to put on the foe list: dataq1, clownbell, gearchange, lynninnj, mper!?, DreamDiver, Geer1, almostadoctor, sleepgeek, ajack, stom, mogy, D.H., They often post misleading, timewasting stuff.
Re: Leak Data
Of course! How stupid of me not to realize that.
My machine is a 960P which I assume is a PR System One REMStar 60 Series BiPAP autoSV Advanced.
Am I correct? Does the "P" indicate Pro (which appears in some of the other items listed).
My machine is a 960P which I assume is a PR System One REMStar 60 Series BiPAP autoSV Advanced.
Am I correct? Does the "P" indicate Pro (which appears in some of the other items listed).
ResMed Air Curve 10 ASV w. humidifier
PR S1 REMstar 60 Series BiPAP ASV Advanced & PR S1 with humidifier
Various Nasal masks or Nasal pillows
Software:
PR S1 REMstar 60 Series BiPAP ASV Advanced & PR S1 with humidifier
Various Nasal masks or Nasal pillows
Software:
Re: Leak Data
My equipment list appeared!!!
It's even easier to use SnagIt over any program. I use it extensively. What's laborious is using PhotoBucket.it's really not difficult to post pics, sleepyhead has a f12 hotkey which works as long as your OS hasn't stolen that away for something else, and imgur makes it easy to post.
ResMed Air Curve 10 ASV w. humidifier
PR S1 REMstar 60 Series BiPAP ASV Advanced & PR S1 with humidifier
Various Nasal masks or Nasal pillows
Software:
PR S1 REMstar 60 Series BiPAP ASV Advanced & PR S1 with humidifier
Various Nasal masks or Nasal pillows
Software:
Re: Leak Data
The P is a shipping/marketing thing. Ignore it.
You need to choose a different humidifier...the current choice is for a 50 series humidifier and it won't work with a 60 series machine.
The correct choice is PR System One 60 Series heated tube humidifier with heated tube (even if you aren't currently using the optional heated hose)
You need to choose a different humidifier...the current choice is for a 50 series humidifier and it won't work with a 60 series machine.
The correct choice is PR System One 60 Series heated tube humidifier with heated tube (even if you aren't currently using the optional heated hose)
_________________
| Machine: AirCurve™ 10 VAuto BiLevel Machine with HumidAir™ Heated Humidifier |
| Additional Comments: Mask Bleep Eclipse https://bleepsleep.com/the-eclipse/ |
I may have to RISE but I refuse to SHINE.