Help me understand individual breaths

General Discussion on any topic relating to CPAP and/or Sleep Apnea.
User avatar
Sludge
Posts: 953
Joined: Wed Dec 04, 2013 4:36 am

Re: Help me understand individual breaths

Post by Sludge » Thu Feb 06, 2014 4:30 am

Setj wrote:Here is a closer look at just the inspiratory portion of typical relaxed breaths while asleep and using CPAP.


Image
Can you put the bottom half back? While looking at "top halves" may be helpful in re: discussion pertaining to that article, if you want to look at waveforms, you need the entire waveform.

AAMOF, some people think (or at least used to) that the expiratory portion can be more important than the inspiratory side. For instance, this guy:

http://sleepdynamictherapy.com/2008/01/ ... low-curve/

keyed his titrations to it.

However, it appears he had a change of heart after a spirited discussion here:

viewtopic.php?f=1&t=26896&st=0&sk=t&sd= ... e&start=30

which ended with the abrupt disappearance of that poster and the removal of the images on his website.

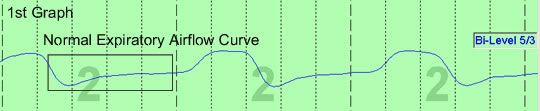
Fortunately, since nothing ever really "disappears" from the internet, those images are presented here:

The Proposed "Normal" Waveform:

Image

The Proposed "Abnormal" Waveform:

Image

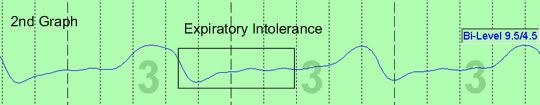
so you can judge for yourself.
You Kids Have Fun!!

User avatar
Sludge
Posts: 953
Joined: Wed Dec 04, 2013 4:36 am

Re: Help me understand individual breaths

Post by Sludge » Thu Feb 06, 2014 4:46 am

Setj wrote:Is our goal with CPAP to achieve #1 waveform shape?
"IMHO", "our" goal is to achieve uninterrupted sleep in sufficient quantity and quality (WNL awakenings, arousals, sleep stages and sleep architecture).

In re: waveforms, those from the article are based on spontaneous breathing, and once you go on xPAP therapy you have a bunch of modes/adjuncts you can use to engineer your waveform.

For instance, VPAP stuff:

Trigger Sensitivity

Image

Cycle Sensitivity

Image[/
You Kids Have Fun!!

User avatar
Setj
Posts: 123
Joined: Fri Dec 20, 2013 6:04 pm
Location: Rochester, NY

Re: Help me understand individual breaths

Post by Setj » Thu Feb 06, 2014 7:07 pm

Sludge wrote: Can you put the bottom half back? While looking at "top halves" may be helpful in re: discussion pertaining to that article, if you want to look at waveforms, you need the entire waveform.
[/

Image

Thanks!
Seth

(I made a typo when I registered the user name. :oops: )

User avatar
Sludge
Posts: 953
Joined: Wed Dec 04, 2013 4:36 am

Re: Help me understand individual breaths

Post by Sludge » Fri Feb 07, 2014 4:03 am

Image

Ewwww!

I mean, what is your resting heart rate, and is it regular?
You Kids Have Fun!!

User avatar
Setj
Posts: 123
Joined: Fri Dec 20, 2013 6:04 pm
Location: Rochester, NY

Re: Help me understand individual breaths

Post by Setj » Fri Feb 07, 2014 7:09 am

Never diagnosed with any heart problems, but it has been a long time since I had an overnight pulse-ox study. Sounds like I should ask for one?

Should I go through the sleep doc or the PCP? I have a good relationship with both and they share my med info.

Thanks!
Seth

(I made a typo when I registered the user name. :oops: )

User avatar
Sludge
Posts: 953
Joined: Wed Dec 04, 2013 4:36 am

Re: Help me understand individual breaths

Post by Sludge » Fri Feb 07, 2014 7:38 am

Setj wrote:Should I go...
No, right now you should tell me your resting heart rate.
You Kids Have Fun!!

Rick007
Posts: 50
Joined: Sun Oct 20, 2013 4:40 pm
Location: Ontario, Canada

Re: Help me understand individual breaths

Post by Rick007 » Fri Feb 07, 2014 7:50 am

Seth, back on page #1 of this thread I mentioned that your Flow graph looked a lot like mine, and that I had a lot of Flow Limitations. You mentioned your Flow Limitations graph looked "nasty" as well. I think FL's are the cause of your ragged Flow graph.

It would be interesting to see your FL graph. In an earlier post I also mentioned how I reduced my FL values by 50% when I increased my pressure from 7.6 cmH2O to 10 cmH20. That helped to smooth out the Flow graph as well.

User avatar
robysue
Posts: 7520
Joined: Sat Sep 18, 2010 2:30 pm
Location: Buffalo, NY
Contact:

Re: Help me understand individual breaths

Post by robysue » Fri Feb 07, 2014 8:49 am

Sludge wrote:
Setj wrote:Is our goal with CPAP to achieve #1 waveform shape?
"IMHO", "our" goal is to achieve uninterrupted sleep in sufficient quantity and quality (WNL awakenings, arousals, sleep stages and sleep architecture).
A worthwhile reminder to us all.

And a question: What are the "normal limits" for awakenings and arousals once the respiratory related awakenings and arousals have been (largely) eliminated by a properly titrated PAP machine?

_________________
Machine: DreamStation BiPAP® Auto Machine
Mask: Swift™ FX Nasal Pillow CPAP Mask with Headgear
Additional Comments: PR System DreamStation and Humidifier. Max IPAP = 9, Min EPAP=4, Rise time setting = 3, minPS = 3, maxPS=5

User avatar
Sludge
Posts: 953
Joined: Wed Dec 04, 2013 4:36 am

Re: Help me understand individual breaths

Post by Sludge » Sat Feb 08, 2014 2:47 am

I would go with 2 - 5 Awakenings, an Arousal Index <5, Total Sleep Time 7.5 hours, and a Sleep Architecture that
  • Moves from wake, through light sleep (NREM1 and 2), followed by deep sleep (NREM3), and finally a REM period.
  • That progression composes a single Sleep Cycle, taking about 90 minutes to complete.
  • There are usually 4-6 Sleep Cycles per night.
  • Most deep/delta/NREM3 sleep occurs in the first Sleep Cycle.
  • The duration of REM periods increase as the night goes on.
  • Normal sleep stage percentages (~) are NREM1 5%, NREM2 55%, NREM3 20%, and REM 20%.
  • Delta sleep generally decreases as a function of age.
Image
You Kids Have Fun!!

User avatar
Sludge
Posts: 953
Joined: Wed Dec 04, 2013 4:36 am

Re: Help me understand individual breaths

Post by Sludge » Sun Feb 09, 2014 3:15 am

Sludge wrote:
Setj wrote:Should I go...
No, right now you should tell me your resting heart rate.
Perhaps it is not clear what a "resting heart rate" is:
The basal or resting heart rate (HRrest) is measured while the subject is relaxed but awake, in a neutrally temperate environment, and not having recently exerted himself or herself nor having been subject to a stress or even a surprise (for example the simple noise of a doorbell can augment the heart rate and blood pressure).
(HRrest) should be about 60 - 80. (HRsleep should certainly be no more than that.

If those tiny waves on the expiratory limb are ballistocardiographic artifact (and I believe they are):

Image

then your HRsleep is ~104, and that might need a little looking into.
You Kids Have Fun!!

User avatar
Setj
Posts: 123
Joined: Fri Dec 20, 2013 6:04 pm
Location: Rochester, NY

Re: Help me understand individual breaths

Post by Setj » Mon Feb 10, 2014 8:24 am

Sludge wrote:
Sludge wrote:
Setj wrote:Should I go...
No, right now you should tell me your resting heart rate.
Perhaps it is not clear what a "resting heart rate" is:
The basal or resting heart rate (HRrest) is measured while the subject is relaxed but awake, in a neutrally temperate environment, and not having recently exerted himself or herself nor having been subject to a stress or even a surprise (for example the simple noise of a doorbell can augment the heart rate and blood pressure).
(HRrest) should be about 60 - 80. (HRsleep should certainly be no more than that.
I kept a pulse-oximeter on the nightstand last night and checked my pulse as soon as I awoke about 6:00 a.m. I left my mask on with the machine running.

Resting heart rate was 67. I am age 65.

Thanks for all your kind help.
Last edited by Setj on Mon Feb 10, 2014 8:36 am, edited 1 time in total.
Seth

(I made a typo when I registered the user name. :oops: )

User avatar
Setj
Posts: 123
Joined: Fri Dec 20, 2013 6:04 pm
Location: Rochester, NY

Re: Help me understand individual breaths

Post by Setj » Mon Feb 10, 2014 8:25 am

Rick007 wrote:Seth, back on page #1 of this thread I mentioned that your Flow graph looked a lot like mine, and that I had a lot of Flow Limitations. You mentioned your Flow Limitations graph looked "nasty" as well. I think FL's are the cause of your ragged Flow graph.

It would be interesting to see your FL graph. In an earlier post I also mentioned how I reduced my FL values by 50% when I increased my pressure from 7.6 cmH2O to 10 cmH20. That helped to smooth out the Flow graph as well.
I will repeat the flow graph under discussion and immediately below it place the flow limitation graph for the same time period.

Image

Image

Thanks for any advice.
Seth

(I made a typo when I registered the user name. :oops: )

Rick007
Posts: 50
Joined: Sun Oct 20, 2013 4:40 pm
Location: Ontario, Canada

Re: Help me understand individual breaths

Post by Rick007 » Mon Feb 10, 2014 6:51 pm

Seth, it is hard to get an idea of how severe your Flow Limitations are when the graph is zoomed in on such a short period of time. FL's normally show up as a flattened peak on the inhalation part of the Flow Graph. Your flow graph does not have much of a flattened peak , and your FL graph also indicates that you are just a fraction away from a pure parabolic shape. I'm not sure what causes the pulses between breaths. Since you have an autoset machine , it may be those pulses are sent out by the machine to see if your airway is opened or closed. If it finds the airway is closed it will increase the pressure.

My FL graph was very ragged, and my flow graph showed the characteristic flattened peaks. I increased my pressure for 7.5 cmH20 up to 10 cmH20, and I saw the flow peaks became more rounded and a corresponding decrease in the jaggedness of the FL graph. My flow graph is not textbook perfect either, but it is an improvement. I have decided to stop worrying about the shape of my graphs since the doctor at the sleep lab didn't think it was important enough to comment on. I will continue to monitor my AHI and most importantly , the way that I feel.

Image
Image
Image
Image

User avatar
Setj
Posts: 123
Joined: Fri Dec 20, 2013 6:04 pm
Location: Rochester, NY

Re: Help me understand individual breaths

Post by Setj » Mon Feb 10, 2014 7:54 pm

Thanks Rick.

Remember, I am less that two months into this and not very knowledgeable. My goal with this thread is to find out if my therapy is performing well.

Here is the FL chart for full night (same night as other charts).

Image

Thanks for all your help!
Seth

(I made a typo when I registered the user name. :oops: )

Rick007
Posts: 50
Joined: Sun Oct 20, 2013 4:40 pm
Location: Ontario, Canada

Re: Help me understand individual breaths

Post by Rick007 » Mon Feb 10, 2014 9:22 pm

Your FL graph certainly is quite messy. The section you zoomed in on in your earlier post didn't even reach the first line. You will probably see flattened peaks on your flow graphs if you examine them at a point that coincides with large peaks on the FL graph. I have found a few bugs with SleepyHead, but the reason I stick with it, is because it places an actual value on the FL values. You can see this on the vertical scale on the graphs I posted earlier and you can see the statistics on the daily summary. Having this numeric value is the only way that I could prove that higher pressure was a benefit to me. Note that the values in this image were obtained when I was running at the lower pressure.

Image