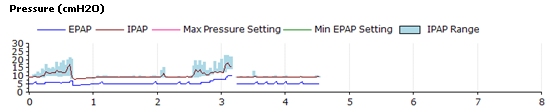
Sometimes waveforms seem to speak for themselves at a glance, but actually I feel I don't even have the basics to make sure of what I see. In the image below, from EncoreBasic, what does the blue range mean on the IPAP data? does it mean that in the vertical time, the IPAP average was the red dot, while the vertical blue line at that precise time would be the actual values that were averaged for the red dot?
If so, what is the time scale for a vertical dot or line? Do the values included in the blue line represent values grouped under this time unit for 10 minutes, or 4 minutes, what length of time?
Sorry if I'm not very clear, I hope someone will understand what I'm trying to ask, and explain this blue range on the IPAP waveform.