Post
by DreamOn » Tue Jul 27, 2010 10:16 am
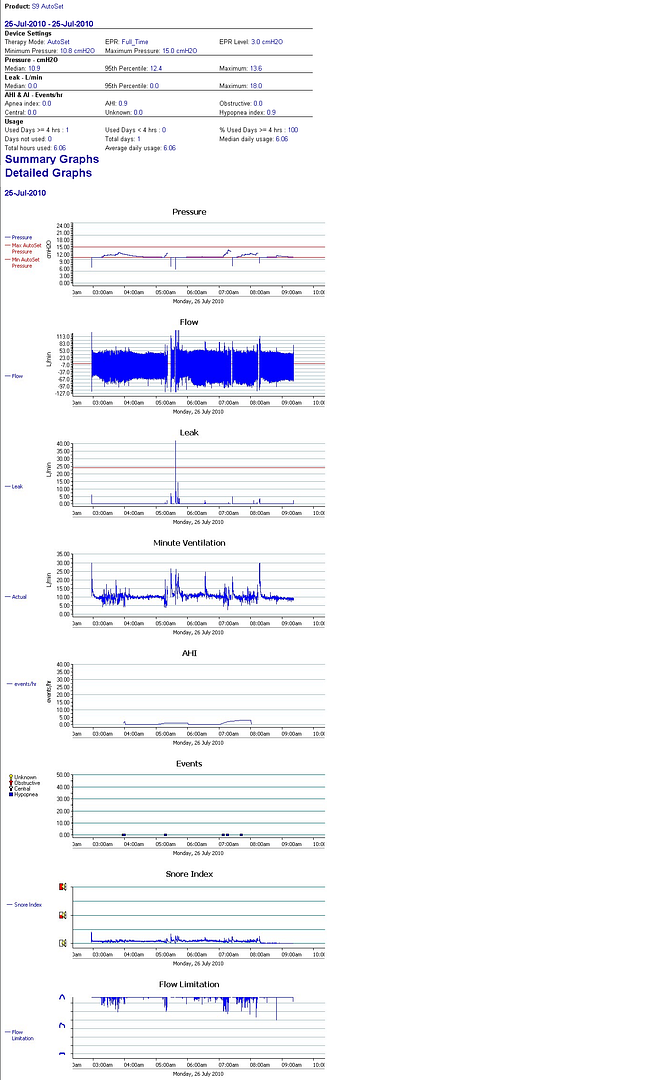
Regarding the order of graph display in ResScan, I like to see mine in this order: Leak, Events, Flow, Flow Limitations, Pressure, Snore Index, Minute Ventilation, and AHI. This would be for the ResMed S9 machines. The S8 machines don't show as many charts.
This is my preference because several of the graphs relate to each other. As echo mentioned, Leak and Events are sometimes related, so it's nice to see those two together.
If you view Flow in the bottom (detailed) panel in a very small time increment (like 10 seconds), you can see how the machine responded to the apnea event by testing to see if the airway was clear (central) or obstructed. That doesn't provide any particularly useful information; I just find it interesting. Most people probably don't care to view that, so I would suggest putting the Flow graph down below the Pressure graph instead because having Events and Flow Limitations next to each other can be very helpful.
When using the machine in Autoset mode, two other charts I like to compare side-by-side are Flow Limitations and Pressure. Because pressure is often driven up due to flow limitations, it's interesting to see how those two interrelate. I find that the 5- and 10-minute views in the lower panel give the best detail for that.
It can be helpful to review where the pressure was when an obstructive apnea occurred too. I rarely have an obstructive apnea, but when I'm using Autoset it usually occurs when the pressure had been lowered because I was having little or no flow limitations to raise the pressure. For me, those particular apneas just hit "out of the blue," often when there was no flow limitation preceding it, so the machine had no warning signs to raise the pressure beforehand and prevent the obstructive apnea from occurring. It does raise the pressure after that apnea occurs, though.
My own Snore Index is usually flat, but too much snoring would probably be indicative of some mild airway obstruction, which might make me think that pressure could be insufficient, although perhaps there would be other reasons for that.
Regarding reports, you can tell ResScan which graphs to display, and in what order. After you create the Report, click on Customize. Then click on the "+" in front of Detailed Graphs to expand it. There you can add, delete and move the graphs that you want displayed in your report. You can customize other report items there as well. Click OK to save your changes.