MaxDarkside wrote:
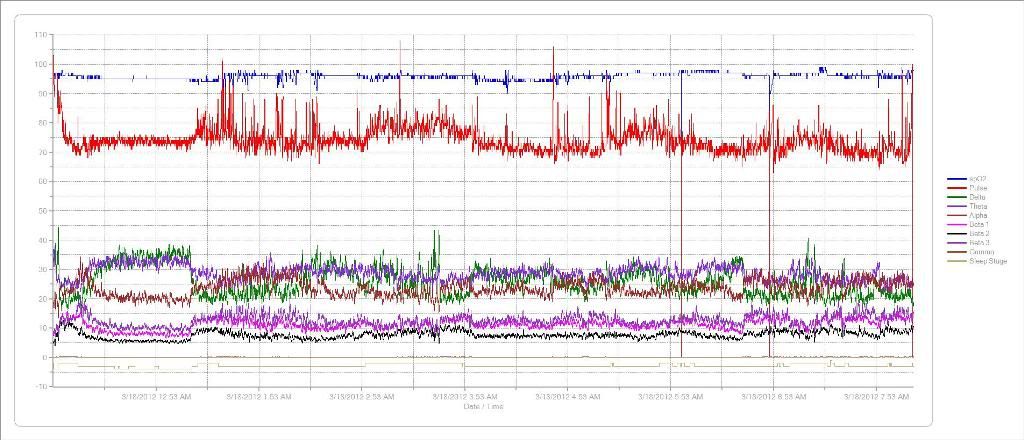
The lower half of this chart are the . . . (Zeo) waves plus the sleep stages (very bottom) from last night. You can see various formations in the data which, to me, are very informative. The top 2 series are my spO2 and heart rate from the CMS 50E.
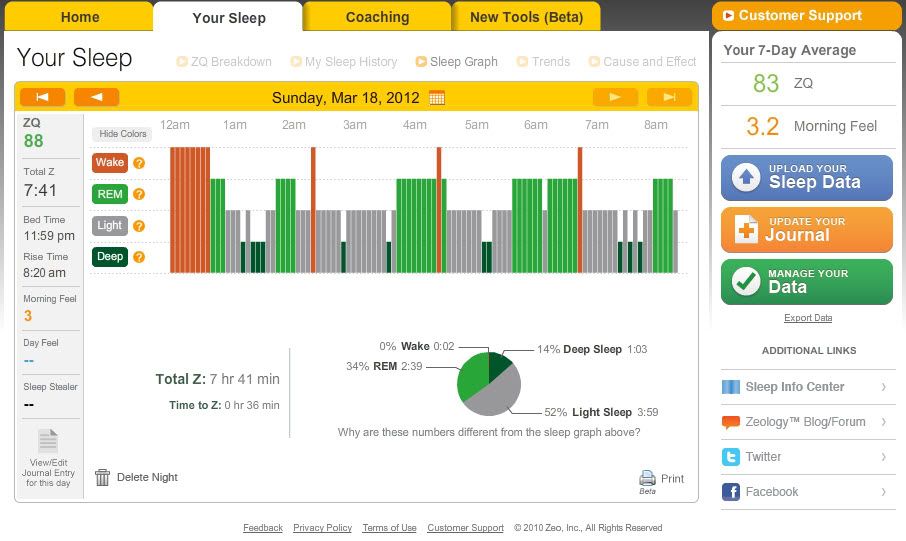
Jay Aitchsee wrote: . . . The accuracy of Zeo can be debated, but I have found it very useful in establishing trends, like is my deep sleep increasing or decreasing? Or, is this medication reducing or increasing the number of awakenings per night? . . .
Jay
Max, Jay and any other Zeo users: For we who don't yet know how to interpret these charts, how do you discern from these example graphs any particular "stages" of sleep? "Open mouths"? I think I see a few, but am not sure. How many open mouths do you folks see, where are they, and what do they mean to you?
Mainly, I'd be happy simply to be able to pick out Stage 3 sleep periods and REM sleep periods. Looking at the pulse ox graphs, can anybody pick such stages out for us novices? Separately, looking at the Zeo brain waves, can anybody pick such stages out? ( If you'd rather post and use your own graphs for this, please do. )
Thanks.