


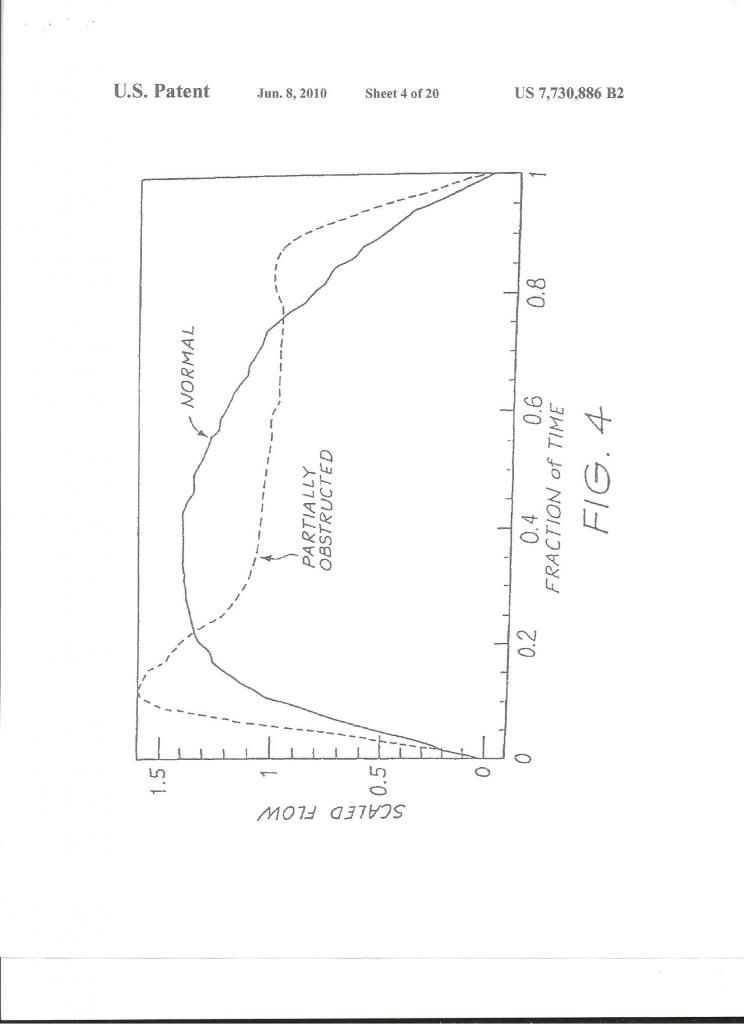
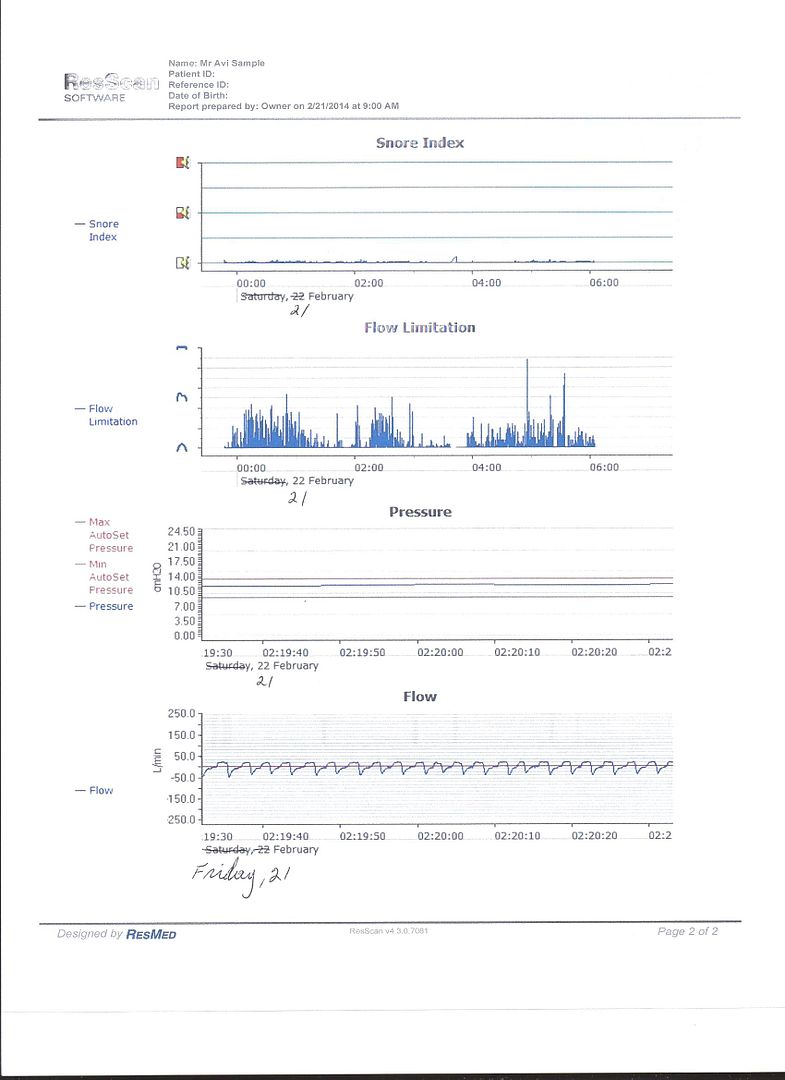
I've been following some discussions about how ResMed scores flow limits in ResScan and SleepyHead. I'm still trying to make sense of the flow limit graph. When the data shows up in SleepHead it is presented on a scale of 0-1. In ResScan, from what I've seen, it's scored on a scale that includes three graphics: a rounded curved, a chair-like curve, and a flat curve, corresponding to 0.0, 0.5 and 1.0 in SleepyHead, respectively. It seems like the number in sleepyhead is arbitrary, and that the graph represents how 'degraded' the flow is, where a rounded or 'normal' curve is 0.0, the mid-level (0.5 in SleepyHead) is a chair-like curve, and the hight level (1.0 in SleepyHead) is a flat curve. If so, perhaps a chair-like curve is marker for moderate flow limit, while the flattened curve is marker for major flow-reduction. This seems to make intuitive sense when viewing the graph, assuming that chair-like flow is moderate, and flattened curve is a major flow limit. I tried to compare the flow limit graph to my flow rate it seems to correspond
Does anyone know if this is the correct way to read the graph?
Also, can someone let me know how to get a copy of ResScan?
Thanks!
Flow Limit Scoring in ResScan


12 posts
• Page 1 of 1
-
UARSsufferer
- Posts: 7
- Joined: Mon Feb 17, 2014 9:07 am
Flow Limit Scoring in ResScan
_________________
| Mask: Pilairo Q Nasal Pillow CPAP Mask with Headgear |
| Humidifier: S9™ Series H5i™ Heated Humidifier with Climate Control |

Re: Flow Limit Scoring in ResScan
ResScan gives you the level of the Flow Limitation by calculating the Flatness (vs. roundness) of the shape of the respiration wave. Those indications in the graphs are just symbols:
I use ResScan and do not bother with SH.
Check also this report about Flow Limitation:
http://journal.publications.chestnet.or ... 28/685.pdf
It takes time to download this article:
Relative Occurrence of Flow Limitation and Snoring During Continuous Positive
Airway Pressure Titration*
By: Indu Ayappa, PhD; Robert G. Norman, MS; Jean-Jacques Hosselet, MD;
Roger A. Gruenke, PhD; Joyce A. Walsleben, PhD; and
David M. Rapoport, MD, FCCP
My Flow Limitation in ResScan:
My Flow Limitation in SleepyHead:

I use ResScan and do not bother with SH.
Check also this report about Flow Limitation:
http://journal.publications.chestnet.or ... 28/685.pdf
It takes time to download this article:
Relative Occurrence of Flow Limitation and Snoring During Continuous Positive
Airway Pressure Titration*
By: Indu Ayappa, PhD; Robert G. Norman, MS; Jean-Jacques Hosselet, MD;
Roger A. Gruenke, PhD; Joyce A. Walsleben, PhD; and
David M. Rapoport, MD, FCCP
My Flow Limitation in ResScan:

My Flow Limitation in SleepyHead:

_________________
| Humidifier: S9™ Series H5i™ Heated Humidifier with Climate Control |
| Additional Comments: S9 Autoset machine; Ruby chinstrap under the mask straps; ResScan 5.6 |
see my recent set-up and Statistics:
http://i.imgur.com/TewT8G9.png
see my recent ResScan treatment results:
http://i.imgur.com/3oia0EY.png
http://i.imgur.com/QEjvlVY.png
http://i.imgur.com/TewT8G9.png
see my recent ResScan treatment results:
http://i.imgur.com/3oia0EY.png
http://i.imgur.com/QEjvlVY.png
-
UARSsufferer
- Posts: 7
- Joined: Mon Feb 17, 2014 9:07 am
Re: Flow Limit Scoring in ResScan
Thanks for that information! If I understand correctly, the flow limitation graph in SleepyHead does not accurately represent the data from a ResMed machine?
_________________
| Mask: Pilairo Q Nasal Pillow CPAP Mask with Headgear |
| Humidifier: S9™ Series H5i™ Heated Humidifier with Climate Control |

Re: Flow Limit Scoring in ResScan
The SleepyHead graph is exactly the same as the Resmed graph except for the labels on the vertical axis.UARSsufferer wrote:Thanks for that information! If I understand correctly, the flow limitation graph in SleepyHead does not accurately represent the data from a ResMed machine?
When you write:
You ARE interpreting both the SH and ResScan versions of the flow limitation graph correctly: The higher the bump (the closer to 1.0 in SH and the closer to the flat icon in ResScan, the more severe the flow limitation is.When the data shows up in SleepHead it is presented on a scale of 0-1. In ResScan, from what I've seen, it's scored on a scale that includes three graphics: a rounded curved, a chair-like curve, and a flat curve, corresponding to 0.0, 0.5 and 1.0 in SleepyHead, respectively. It seems like the number in sleepyhead is arbitrary, and that the graph represents how 'degraded' the flow is, where a rounded or 'normal' curve is 0.0, the mid-level (0.5 in SleepyHead) is a chair-like curve, and the hight level (1.0 in SleepyHead) is a flat curve. If so, perhaps a chair-like curve is marker for moderate flow limit, while the flattened curve is marker for major flow-reduction. This seems to make intuitive sense when viewing the graph, assuming that chair-like flow is moderate, and flattened curve is a major flow limit. I tried to compare the flow limit graph to my flow rate it seems to correspond
Does anyone know if this is the correct way to read the graph?
_________________
| Machine: DreamStation BiPAP® Auto Machine |
| Mask: Swift™ FX Nasal Pillow CPAP Mask with Headgear |
| Additional Comments: PR System DreamStation and Humidifier. Max IPAP = 9, Min EPAP=4, Rise time setting = 3, minPS = 3, maxPS=5 |
Re: Flow Limit Scoring in ResScan
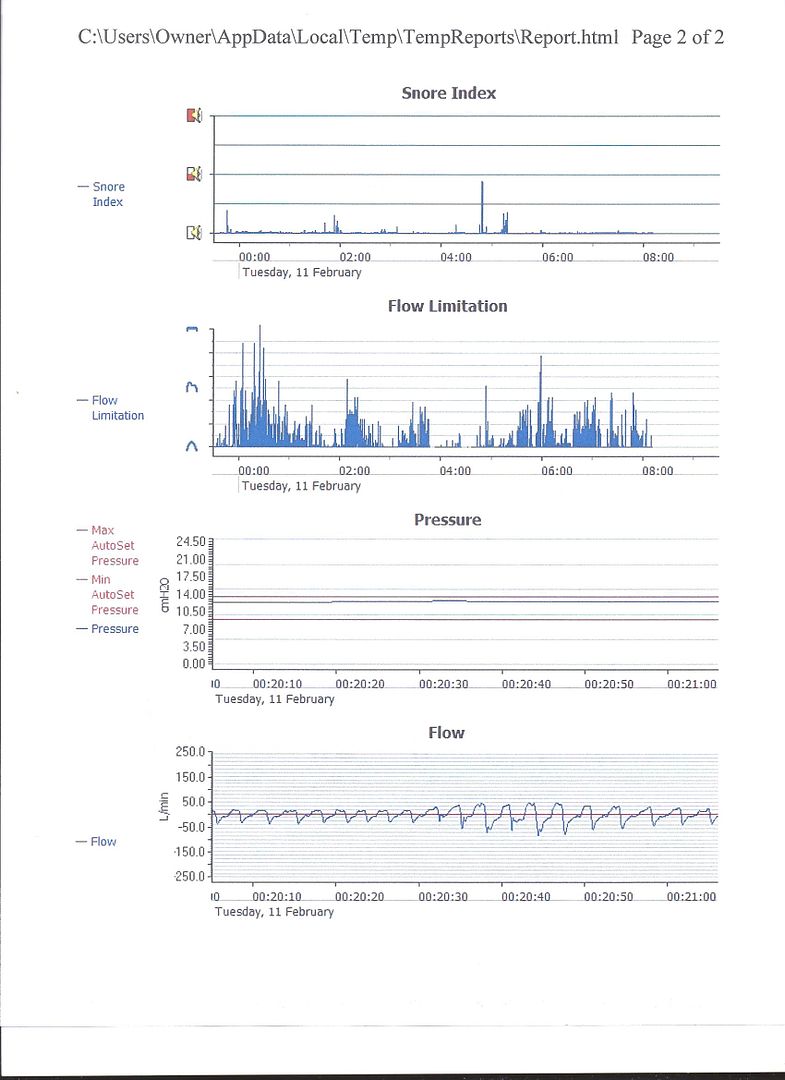
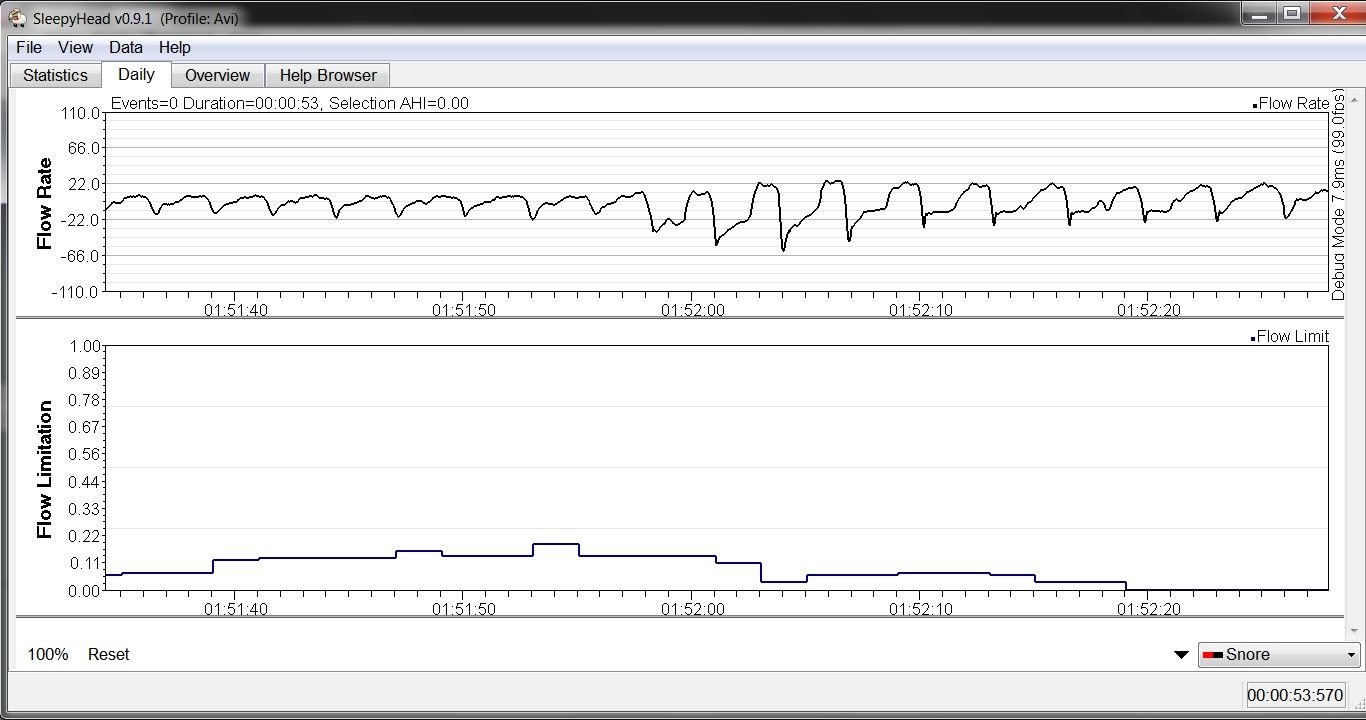
Perhaps these images will help make this point. Both graphs are for the same period on February 17. The only difference I notice are the lines that reach the midway point of the Rescan graph (e.g. 00:20 hrs) only read as .25 on the Sleepyhead scale. I prefer using Sleepyhead to monitor my Flow Limitations because it gives them a numerical value on the "Statistics" section so that I can immediately see the effect of any changes I make with pressure, EPR, etc.robysue wrote:The SleepyHead graph is exactly the same as the Resmed graph except for the labels on the vertical axis.
NOTE: I did notice that the Statistics graph shows my FLmax=.15 and the graph shows me reaching .30 at different times.


_________________
| Mask: Eson™ Nasal CPAP Mask with Headgear |
| Humidifier: S9™ Series H5i™ Heated Humidifier with Climate Control |
-
UARSsufferer
- Posts: 7
- Joined: Mon Feb 17, 2014 9:07 am
Re: Flow Limit Scoring in ResScan
I see now - thanks for the graphs.
I was diagnosed with UARS, and while I feel better on CPAP, it's not much of an improvement. I wonder if I can find more improvement still. Has anyone with a ResMed machine used Flow Limit as an indicator to adjust their pressure? And if so, do you notice a subjective difference? (Do you feel better the next day?).
I was diagnosed with UARS, and while I feel better on CPAP, it's not much of an improvement. I wonder if I can find more improvement still. Has anyone with a ResMed machine used Flow Limit as an indicator to adjust their pressure? And if so, do you notice a subjective difference? (Do you feel better the next day?).
_________________
| Mask: Pilairo Q Nasal Pillow CPAP Mask with Headgear |
| Humidifier: S9™ Series H5i™ Heated Humidifier with Climate Control |
Re: Flow Limit Scoring in ResScan
For many of us who have no significant central component to our sleep-breathing troubles, we will take it upon ourselves to try a slightly higher pressure for a few weeks every now and then (especially if our sleep doesn't seem refreshing to us) just to see how we feel. This is true whether we have data to help us do that or not. And this is true whether we consider ourselves to "have" UARS or not. Since the major variable we have at our fingertips to control is amount of pressure, and since the most important yardstick for sleep is how we feel, we generally try not to put too much stock in machine-estimated "events" other than apneas. However, if any adjustment to pressure increases the number of home-machine-estimated events over time, we assume we did not move the pressure in the right direction. That is a key principle for using the home-machine data for trending use, which is the use for which the data is provided and for which the graphs are designed.
-
StuUnderPressure
- Posts: 1378
- Joined: Mon Jun 18, 2012 10:34 am
- Location: USA
Re: Flow Limit Scoring in ResScan
UARSsufferer wrote:I was diagnosed with UARS, and while I feel better on CPAP, it's not much of an improvement. I wonder if I can find more improvement still. Has anyone with a ResMed machine used Flow Limit as an indicator to adjust their pressure? And if so, do you notice a subjective difference? (Do you feel better the next day?).
I do not have UARS, only plain vanilla Sleep Apnea.
However, my Flow Limitation graph in ResScan IS pretty ugly - even though my AHI is almost always under 3 & under 1.5 quite a bit. And my AHI consists of ONLY Hypopneas.
I tried increasing my lower Auto Pressure & left it there for 10 days.
Made absolutely NO difference in the data (Flow Limitations nor AHI) & NO difference in how I feel.
So, I dropped it back down to where it was previously.
_________________
| Machine: AirCurve™ 10 VAuto BiLevel Machine with HumidAir™ Heated Humidifier |
| Additional Comments: Cleanable Water Tub & Respironics Premium Chinstrap |
In Windows 10 Professional 64 bit Version 22H2 - ResScan Version 7.0.1.67 - ResScan Clinician's Manual dtd 2021-02
SD Card Formatter 5.0.2 https://www.sdcard.org/downloads/format ... index.html
SD Card Formatter 5.0.2 https://www.sdcard.org/downloads/format ... index.html
Re: Flow Limit Scoring in ResScan
Reply,UARSsufferer wrote:I see now - thanks for the graphs.
I was diagnosed with UARS, and while I feel better on CPAP, it's not much of an improvement. I wonder if I can find more improvement still. Has anyone with a ResMed machine used Flow Limit as an indicator to adjust their pressure? And if so, do you notice a subjective difference? (Do you feel better the next day?).
As you see in my above ResScan graph I have a medium level of FL but I have not set my pressures to deal with it. I did set the pressures on my APAP as follows:
In my recent sleep lab test my prescribed therapeutic pressure on CPAP was 13 cm, on CPAP. So I set the max pressure on my APAP 13.0 cm and 11.0 cm as min. Next, I spent a night with this setting and got a pressure graph in ResScan. The graph showed the actual pressure curve plus the two limit lines. Next, I started adjusting the set-up on the APAP so that the pressure curve only "kissed" those limit lines. The reasons: I don’t want the machine to suddenly boost the pressure, needlessly, and give me emergent central apneas (Complex Sleep Apnea) and also cause more leaks b/c of the higher pressure. As to the low pressure limit I set it so to have the machine respond more quickly to events.
After a few weeks of adjustments I have settled on the followings:

Presently, I don't know how to further adjust the pressures to reduce my FL.
This whole business of FL, UARS, and RERAS, is not simple. I don't think that I suffer from those ailments as described in medical reports, such as this one, and I think that the only way to reduce the FL is surgically.
Upper Airway Resistance Syndrome
PCCSU Article | 07.01.11
________________________________________
Table 1—Clinical Features Associated With UARS
Daytime symptoms
Excessive daytime sleepiness
Fatigue
Morning headaches
Myalgias
Difficulty concentrating
Sleep disturbances
Frequent nocturnal awakenings
Difficulties initiating sleep
Insomnia
Bruxism
Restless leg syndrome
Unrefreshing sleep
Autonomic nervous system
Hypotension
Orthostasis
Cold hands and feet
Functional somatic syndrome associations
Depression
Anxiety
Chronic fatigue syndrome
Irritable bowel syndrome
Fibromyalgia
Polysomnographic abnormalities
Increased RERAs
Increased nocturnal arousals
Increased CAP rate
Alpha intrusion during sleep
________________________________________
Diagnosis
Patients with UARS can present with a constellation of generalized and/or specific symptoms and a clinical examination often demonstrates craniofacial abnormalities. As noted previously, many of the prior difficulties in making a diagnosis of UARS arose because these patients do not meet polysomnographic criteria for OSAS. In the original description of UARS back in 1991, repetitive increases in upper airway resistance associated with arousals were observed in 15 subjects, defined as an increase in the peak inspiratory esophageal pressure that immediately preceded a transient arousal.3 A diagnosis of UARS requires patient symptoms, evidence of upper airway narrowing or craniofacial abnormalities, and appropriate associated polysomnographic findings. When an overnight polysomnogram is performed on a patient with UARS, there are no apneas with a hypopnea index <5, the oxygen saturation is usually >92%, and there is evidence of respiratory effort-related arousals (RERAs). Flow limitation can also be present, identified as an abnormal contour in the nasal pressure transducer signal waveform.3,14 Other techniques have been used to detect the subtle changes in respiration, such as the oral/nasal thermistor, pneumotachograph, quantitative respiratory plethysmography, and nasal cannula/pressure transducer, although measurement of esophageal pressure (Pes), or esophageal manometry, remains the gold standard.26,27
Typically, a pediatric feeding tube is used in the measurements of esophageal pressure during sleep. A number of characteristic Pes patterns associated with RERAs have been described.28,29 Pes crescendo (Fig 1) is a progressive increase in negative peak inspiratory pressure with each breath that terminates with an EEG arousal, typically a burst of alpha or delta activity. Other changes include sustained continuous respiratory effort; the Pes tracing shows a stable and persistently abnormal negative peak inspiratory pressure, different from the baseline pressure and present for more than four breaths. In both instances, the increase in respiratory effort is not usually associated with oxyhemoglobin desaturation and there may be a flattening in the nasal pressure transducer waveform, consistent with flow limitation (Figs 2, 3). The termination of both Pes crescendo and flow limitation is called Pes reversal, which is a decrease in respiratory effort indicated by a less negative peak inspiratory pressure, often without an associated EEG arousal (Fig 4). Heart rate variability is often seen during events of increased respiratory effort. Patients with UARS may also have more negative peak inspiratory pressure during nonrapid eye movement (NREM) sleep, especially slow-wave sleep, as compared with rapid eye movement sleep.30 Patients with UARS have also been described to have less NREM (both stage 1 and stage 2) sleep and more slow-wave sleep when compared with other patients with sleep-disordered breathing, although no significant difference in arousal threshold was seen.31
Treatment
The optimal treatment for patients with UARS is not currently known. Continuous positive airway pressure (CPAP) has been quite useful in the treatment of sleep-disordered breathing and there are some notable positive results in CPAP treatment of UARS. In a study of 15 heavy snorers with clinical evidence of UARS, treatment with nasal CPAP was associated with decreases in observed nocturnal arousals on polysomnography and decreases in mean sleep latency times on multiple sleep latency testing (MSLT) after several nights of treatment.3,36 A follow-up study of 15 subjects (in the original description of UARS) with daytime sleepiness and fatigue and who had undergone a therapeutic trial of positive pressure therapy reported similar findings.3 After treatment with approximately a month of nasal CPAP, significant improvements were seen in mean sleep latency times on MSLT (5.3 minutes vs 13.5 minutes), Pes nadir pressure (–33.1 cm H2O vs –5.3 cm H2O), amount of slow-wave sleep (1.2% vs 9.7%), and EEG arousals (31.3 vs 7.9 events/hour of sleep). Along with an improvement in sleep latency times on MSLT, there were subjective reports of improved daytime symptoms. Lastly, in a study of 130 postmenopausal women with chronic insomnia and evidence of UARS (n=62) or normal breathing (n=68), treatment with either nasal turbinectomy or nasal CPAP was associated with improvements in subjective reports of sleep quality as measured with a visual analog scale as well as mean sleep latency times on polysomnography.19 Despite the growing body of evidence supporting the use of positive pressure therapy for UARS patients, it remains difficult to obtain therapy. In a follow-up study of more than 90 patients conducted 4 to 5 years after the initial diagnosis of UARS was made, none of the subjects were receiving CPAP treatment; the main rationale given was that their insurance provider declined to provide the necessary equipment.1 Formal follow-up clinical evaluations of these patients noted significant worsening in their sleep-related complaints, with increased reports of fatigue, insomnia, and depressive mood. More disturbingly, prescriptions for hypnotics, stimulants, and antidepressants increased more than fivefold.
Other interventions, such as surgery or oral appliances, have also been used with some success in the treatment of patients with UARS. Procedures such as uvulopalatopharyngoplasty, laser-assisted uvuloplasty (LAUP), septoplasty with turbinate reduction, genioglossus advancement, and radiofrequency ablation of the palate have all been described in the literature.37-40 A study of LAUP in nine patients with UARS who underwent uvulopalatopharyngoplasty (n=2), multilevel pharyngeal surgery (n=1), or LAUP (n=6) reported improvements in subjective daytime sleepiness as measured with Epworth Sleepiness Scale scores.37 In the two patients for whom postoperative polysomnographic data was available, significant improvements in Pes nadir pressures were seen. But patients had several interventions and it is difficult to assess which one was successful. A study of 14 patients with UARS who underwent radiofrequency ablation of the palate also reported improvement in subjective sleepiness, with concurrent improvements in Pes nadir levels and reports of snoring.40 However, prior reviews of the available literature have noted that many of the studies evaluated small numbers of patients, consisted of uncontrolled case reports or series without clear characterization of the subjects enrolled, and had no consistent end points for an adequate evaluation of efficacy.39 Further investigation is required to determine the specific role for surgical intervention in these patients. Other authors have also reported successful treatment of UARS with use of oral appliances, although these studies suffer from the same limitations as the surgical literature.41 In children, orthodontic approaches, such as maxillary distraction or use of expanders, have also shown promising results.42
________________________________________
_________________
| Humidifier: S9™ Series H5i™ Heated Humidifier with Climate Control |
| Additional Comments: S9 Autoset machine; Ruby chinstrap under the mask straps; ResScan 5.6 |
see my recent set-up and Statistics:
http://i.imgur.com/TewT8G9.png
see my recent ResScan treatment results:
http://i.imgur.com/3oia0EY.png
http://i.imgur.com/QEjvlVY.png
http://i.imgur.com/TewT8G9.png
see my recent ResScan treatment results:
http://i.imgur.com/3oia0EY.png
http://i.imgur.com/QEjvlVY.png
Re: Flow Limit Scoring in ResScan
Surgery might indeed be one way to keep FL from showing up in one's home-machine graphs. But it can be difficult to get insurance to pay for surgery to treat one's ResScan/Sleepyhead graphs. I mean, making medical decisions, such as having surgery, in order to improve home-machine trending data would be pretty silly, right?. . . reduce the FL surgically.
As for actually treating actual medical conditions (and being worried about FLs in one's home-machine trending data is not, contrary to the opinion of some on this board, accepted by anyone as an actual medical condition, at least not a physical one), surgery for UARS or milder OSA can be tricky business, indeed.
In my opinion, as a general rule the only people with UARS who get surgery (or get it paid for, anyway) are the ones with obvious anatomical deformities. So the surgery numbers will tend to look good, depending on how the data is massaged.
Some interesting observations based on one small study that looked at nasal surgeries:
"The effects of nasal surgery on sleep apnea parameters are noted to be unpredictable and unreliable . . . A single study . . . looked at 49 patients with OSA and actually showed worsening of RDI in patients with mild OSA undergoing nasal surgery alone. . . . CPAP levels required to correct OSA decreased after nasal surgery (P < 0.01). However, patients with mild OSA showed significant worsening in RDI (P < 0.05), whereas LSaO2 levels were improved in the group with moderate OSA (P < 0.05). In patients with severe OSA neither the RDI levels nor the LSaO2 changed, but CPAP levels required to alleviate the obstruction after surgery were reduced. --http://link.springer.com/article/10.100 ... ltext.html
Re: Flow Limit Scoring in ResScan
Comment,UARSsufferer wrote:I've been following some discussions about how ResMed scores flow limits in ResScan and SleepyHead. I'm still trying to make sense of the flow limit graph. When the data shows up in SleepHead it is presented on a scale of 0-1. In ResScan, from what I've seen, it's scored on a scale that includes three graphics: a rounded curved, a chair-like curve, and a flat curve, corresponding to 0.0, 0.5 and 1.0 in SleepyHead, respectively. It seems like the number in sleepyhead is arbitrary, and that the graph represents how 'degraded' the flow is, where a rounded or 'normal' curve is 0.0, the mid-level (0.5 in SleepyHead) is a chair-like curve, and the hight level (1.0 in SleepyHead) is a flat curve. If so, perhaps a chair-like curve is marker for moderate flow limit, while the flattened curve is marker for major flow-reduction. This seems to make intuitive sense when viewing the graph, assuming that chair-like flow is moderate, and flattened curve is a major flow limit. I tried to compare the flow limit graph to my flow rate it seems to correspond
Does anyone know if this is the correct way to read the graph?
Also, can someone let me know how to get a copy of ResScan?
Thanks!
My S9 Autoset does not want to raise the pressure during my FL, while in APAP mode. If I raise the max pressure higher then the machine just disregards it. May be switching to CPAP mode would force the machine to treat the FL better. But then I take a chance of getting Centrals. You with your Elite could experiment with it.
_________________
| Humidifier: S9™ Series H5i™ Heated Humidifier with Climate Control |
| Additional Comments: S9 Autoset machine; Ruby chinstrap under the mask straps; ResScan 5.6 |
see my recent set-up and Statistics:
http://i.imgur.com/TewT8G9.png
see my recent ResScan treatment results:
http://i.imgur.com/3oia0EY.png
http://i.imgur.com/QEjvlVY.png
http://i.imgur.com/TewT8G9.png
see my recent ResScan treatment results:
http://i.imgur.com/3oia0EY.png
http://i.imgur.com/QEjvlVY.png
Re: Flow Limit Scoring in ResScan
More about the S9 and FL:
From Resmed:
http://www.resmed.com/au/clinicians/com ... clinicians
How does a ResMed AutoSet device respond to flow limitation?
•If flow limitation is detected, AutoSet Spirit responds by gradually increasing pressure to bring the airway back to normal. Typically, this helps prevent snoring and apneas.
•If no further events occur, AutoSet Spirit gently decreases the pressure, towards the minimum set pressure
and
http://www.resmed.com/us/clinicians/com ... clinicians
Breath-by-breath monitoring and flow-time curve analysis:
AutoSet machines monitor breathing on a breath-by-breath basis and deliver only the pressure that patients need—when they need it.
AutoSet devices actually act preemptively by monitoring the patient's inspiratory flow-time curve. A flattening of the inspiratory flow-time curve typically precedes an upper airway obstruction, which will cause an apnea, hypopnea, or snoring.
By monitoring and responding to the flow-time curve, AutoSet devices reduce the number of respiratory events and arousals, enabling better sleep quality.
Studies suggest that using the flow-time curve is preferable to responding to apneas and hypopneas directly and that clinicians should use the flow-time curve to achieve optimal pressure during titration.3,4
Well, the S9 does not do it completely in my case:

It did not raise the pressure enough to "bring the airway back to normal" when my respiration waves were flat:

_________________
| Humidifier: S9™ Series H5i™ Heated Humidifier with Climate Control |
| Additional Comments: S9 Autoset machine; Ruby chinstrap under the mask straps; ResScan 5.6 |
see my recent set-up and Statistics:
http://i.imgur.com/TewT8G9.png
see my recent ResScan treatment results:
http://i.imgur.com/3oia0EY.png
http://i.imgur.com/QEjvlVY.png
http://i.imgur.com/TewT8G9.png
see my recent ResScan treatment results:
http://i.imgur.com/3oia0EY.png
http://i.imgur.com/QEjvlVY.png
12 posts
• Page 1 of 1