Greetings! I'll see if I can take a stab at helping you to understand the data in the report. I will also pose some questions that you might ask of her doctor. With more complicated sleep issues, such as Complex Sleep Apnea, we tend to recommend that you discuss changes to your therapy with your doctor.
Let me provide an example from my own experience, I noted that my AHI score inched up over the past year. Nothing bad, but I thought that ahead of my next appointment with my neurologist I should run an experiment to see how my numbers change. For a couple weeks, I set my EPAP pressure from 9 to 14. Then a couple weeks I set it at 10 to 15. And then for the next two weeks (I'm still in the middle of it), I set my EPAP pressure form 11 to 16. I can then show him the change to my AHI value with those pressure ranges. It's clearly showing that I do better with an EPAP pressure range of 11 to 16. But I will discuss it with my neurologist. He might want another sleep study to confirm the finding .. and also to observe another behavior I've seen of hypo-ventilation throughout the night. (I see a gradual drop in my O2 saturation until it appears I rouse and then it starts all over again .. over and over). I don't think my numbers warrant any action yet, but I will present what I found for him to review.
So, you get the idea. Even if you change something, be certain to discuss it with her doctor.
Now, let me tackle a few things (three actually) that I noted in the graphs.
First, she has a lot of pressure swings on the IPAP side:
Pressure at Mask:
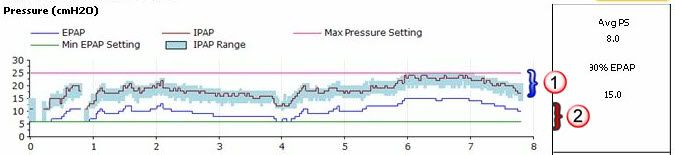
As you can see in this graph, the blue shaded area - noted as "(1)" in the graphs - shows the range of the IPAP pressure. That broad range indicates her unit was constantly bumping up the pressure to help sustain her respiration. You will note that in her sleep therapy flags graph there are a lot of central apneas and periodic breathing. The unit was responding to that tendency.
I do not advocate changing anything. Rather just be aware that this constant change of pressure may make sleeping with her ASV unit a bit challenging. It may take some time to fully adjust to such a dynamic environment while asleep.
Second, you will note the EPAP value starts pretty low, even though it ratchets up. This seems too low in my opinion.
I would specifically ask her sleep doctor if it might not be better to have the pressure a bit higher .. perhaps 8 or 10cm H2O .. to try to avoid the low side of the EPAP range ... and better allow the unit to better handle the obstructive sleep apneas and hypopneas. She still has a LOT of obstructive apneas. An AHI score of 39 is no where near low enough.
Sleep Therapy:

As you can see, the high number of obstructive sleep apnea (OA) and hypopnea (H) events tends to driver her AHI score very high. I would think her doctor would want to address this.
The third major thought deals with her own breathing. The good news is that even though her breathing is not as predictable as we might like, it is not all that bad.
Patient Triggered Breathing:

Though 88% seems low, it is not as bad as others here normally have. In fact, based on the BPM graph below, I suspect most of the problems her unit saw was related to central apneas rather than a breath rate that was too low.
It's possible that changing the BPM value to AUTO from 10 would actually decrease her PTB score. That is, the unit would tend to more periodically think that she is not breathing when she should .. based on the past three minutes or so of her breathing. However, it might drop some of the Central Apnea scores by doing that. In essence it would probably be a "wash" in her therapy. PTB would decrease (not good), but CA would decrease (good).
Breaths Per Minute:

Again, this would be something you might ask her doctor .. why not use AUTO for this setting. However, you will note that with an BPM of 10 there was only one period when it dropped that low. So, it should not be a big deal.
Once again, I would stress that you will want to work in conjunction with her doctor. What's more important for you (and her) right now is a better understanding of the data in the graphs. I hope this reply helps with that.
Note: Edited to correct Pressure graph.


