


Editing the ResScan XML Files to Show Me What I want
Sorry if this is a duplication but I did search, really I did.
I have the ResMed S9 Elite with the H5i heated humidifier and Nasal Pillow mask. I use ResScan 3.14 (the latest version as far as I know) to analyse the data from the data card. I recently started editing the XML files to get the program to show a little more data. What I have accomplished so far is getting it to export pressure info to a CSV file which I read with Excel. However, the data is limited to whole numbers in the CSV file, even though it is in 2-place decimals in the ResScan program.
So, 2 things I would like to be able to do. Export the Pressure data in 2 decimal place values and also to get ResScan to show the Flow Graph.
Any ideas out there?
Editing the ResScan XML Files to Show Me What I want


15 posts
• Page 1 of 1
-
datguykirt

- Posts: 7
- Joined: Sat Jun 11, 2011 2:48 pm
- Location: Uuuummm...I'm right here!
Editing the ResScan XML Files to Show Me What I want
_________________
| Mask | Humidifier | |||
 |  | |||
| Additional Comments: The software I use is actually the latest, ResScan 3.14 but that option was not available here. | ||||
Really? I showered and shaved for THIS?

Re: Editing the ResScan XML Files to Show Me What I want
Do you have Flow checked in the list of graphs, the tab to the right of the serial number box in the detailed graphs window?
What are you wanting to see, or accomplish, by looking at the pressure data in Excel as opposed to what you see in Resscan? There might be an easier way.
What are you wanting to see, or accomplish, by looking at the pressure data in Excel as opposed to what you see in Resscan? There might be an easier way.
_________________
| Mask: AirFit™ P10 Nasal Pillow CPAP Mask with Headgear |
| Humidifier: S9™ Series H5i™ Heated Humidifier with Climate Control |
| Additional Comments: Hose management - rubber band tied to casement window crank handle! Hey, it works! S/W is 3.13, not 3.7 |

Re: Editing the ResScan XML Files to Show Me What I want
If you're talking about a spreadsheet in Excel like this then I don't use it:

_________________
| Humidifier: S9™ Series H5i™ Heated Humidifier with Climate Control |
| Additional Comments: S9 Autoset machine; Ruby chinstrap under the mask straps; ResScan 5.6 |
see my recent set-up and Statistics:
http://i.imgur.com/TewT8G9.png
see my recent ResScan treatment results:
http://i.imgur.com/3oia0EY.png
http://i.imgur.com/QEjvlVY.png
http://i.imgur.com/TewT8G9.png
see my recent ResScan treatment results:
http://i.imgur.com/3oia0EY.png
http://i.imgur.com/QEjvlVY.png

Re: Editing the ResScan XML Files to Show Me What I want
What kind of "whole numbers" are you seeing? Are they like 3-digits?datguykirt wrote:Editing the ResScan XML Files to Show Me What I want
Sorry if this is a duplication but I did search, really I did.
I have the ResMed S9 Elite with the H5i heated humidifier and Nasal Pillow mask. I use ResScan 3.14 (the latest version as far as I know) to analyse the data from the data card. I recently started editing the XML files to get the program to show a little more data. What I have accomplished so far is getting it to export pressure info to a CSV file which I read with Excel. However, the data is limited to whole numbers in the CSV file, even though it is in 2-place decimals in the ResScan program.
So, 2 things I would like to be able to do. Export the Pressure data in 2 decimal place values and also to get ResScan to show the Flow Graph.
Any ideas out there?
"Don't Blame Me...You Took the Red Pill..."
Re: Editing the ResScan XML Files to Show Me What I want
In order to see the flow after you've checked it, you have to download the details.
_________________
| Mask: AirFit™ P10 Nasal Pillow CPAP Mask with Headgear |
| Additional Comments: Machine: Resmed AirSense10 for Her with Climateline heated hose ; alternating masks. |
And now here is my secret, a very simple secret; it is only with the heart that one can see rightly, what is essential is invisible to the eye.
Antoine de Saint-Exupery
Good advice is compromised by missing data
Forum member Dog Slobber Nov. 2023
Antoine de Saint-Exupery
Good advice is compromised by missing data
Forum member Dog Slobber Nov. 2023
Re: Editing the ResScan XML Files to Show Me What I want
If so, you may need to apply a "correction factor", noted in another file that appears during an *.edf conversion:NotMuffy wrote:What kind of "whole numbers" are you seeing? Are they like 3-digits?datguykirt wrote:Editing the ResScan XML Files to Show Me What I want
Sorry if this is a duplication but I did search, really I did.
I have the ResMed S9 Elite with the H5i heated humidifier and Nasal Pillow mask. I use ResScan 3.14 (the latest version as far as I know) to analyse the data from the data card. I recently started editing the XML files to get the program to show a little more data. What I have accomplished so far is getting it to export pressure info to a CSV file which I read with Excel. However, the data is limited to whole numbers in the CSV file, even though it is in 2-place decimals in the ResScan program.
So, 2 things I would like to be able to do. Export the Pressure data in 2 decimal place values and also to get ResScan to show the Flow Graph.
Any ideas out there?
so if you see a number like 450, it would seem to calculate to be 9.00 cmH2O.Physical value cmH2O = (ASCII-0)*0.020
"Don't Blame Me...You Took the Red Pill..."
-
datguykirt
- Posts: 7
- Joined: Sat Jun 11, 2011 2:48 pm
- Location: Uuuummm...I'm right here!
Re: Editing the ResScan XML Files to Show Me What I want
The whole numbers are 9, 10, 11, etc. depending on the setting I use for the pressure. But in fact, the settings are 9.5, 10.6 etc...the decimal places do not show up in the exported file. I've been going through the XML files and altering the entries for "Decimal Precision" but so far, no joy. The purpose of this little exercise is to be able to graph pressure, leak, and AI/AHI together to see if there is a relationship.NotMuffy wrote:What kind of "whole numbers" are you seeing? Are they like 3-digits?datguykirt wrote:Editing the ResScan XML Files to Show Me What I want
Sorry if this is a duplication but I did search, really I did.
I have the ResMed S9 Elite with the H5i heated humidifier and Nasal Pillow mask. I use ResScan 3.14 (the latest version as far as I know) to analyse the data from the data card. I recently started editing the XML files to get the program to show a little more data. What I have accomplished so far is getting it to export pressure info to a CSV file which I read with Excel. However, the data is limited to whole numbers in the CSV file, even though it is in 2-place decimals in the ResScan program.
So, 2 things I would like to be able to do. Export the Pressure data in 2 decimal place values and also to get ResScan to show the Flow Graph.
Any ideas out there?
_________________
| Mask | Humidifier | |||
| | |||
| Additional Comments: The software I use is actually the latest, ResScan 3.14 but that option was not available here. | ||||
Really? I showered and shaved for THIS?
-
datguykirt
- Posts: 7
- Joined: Sat Jun 11, 2011 2:48 pm
- Location: Uuuummm...I'm right here!
Re: Editing the ResScan XML Files to Show Me What I want
[quote="avi123"]If you're talking about a spreadsheet in Excel like this then I don't use it:
Yes, that's the output except I've altered the XML file so the output includes pressure. The problem is that the pressure is all in "whole numbers"...no decimal places. I want to be able to graph Pressure, Leak, AI and AHI together over time to see if there is a relationship.
Yes, that's the output except I've altered the XML file so the output includes pressure. The problem is that the pressure is all in "whole numbers"...no decimal places. I want to be able to graph Pressure, Leak, AI and AHI together over time to see if there is a relationship.
_________________
| Mask | Humidifier | |||
| | |||
| Additional Comments: The software I use is actually the latest, ResScan 3.14 but that option was not available here. | ||||
Really? I showered and shaved for THIS?
-
datguykirt
- Posts: 7
- Joined: Sat Jun 11, 2011 2:48 pm
- Location: Uuuummm...I'm right here!
Re: Editing the ResScan XML Files to Show Me What I want
Yes, "Flow" is checked. I know the data is available because I can see it in an EDF browser I downloaded. Perhaps it is being omitted because my machine is an Elite and not an Autoset.idamtnboy wrote:Do you have Flow checked in the list of graphs, the tab to the right of the serial number box in the detailed graphs window?
What are you wanting to see, or accomplish, by looking at the pressure data in Excel as opposed to what you see in Resscan? There might be an easier way.
_________________
| Mask | Humidifier | |||
| | |||
| Additional Comments: The software I use is actually the latest, ResScan 3.14 but that option was not available here. | ||||
Really? I showered and shaved for THIS?
Re: Editing the ResScan XML Files to Show Me What I want
You must be looking at the *.rlk file after the file has been processed. Look at the pre-processed format (read directly from the card) and the "real" numbers are there.datguykirt wrote:The whole numbers are 9, 10, 11, etc. depending on the setting I use for the pressure. But in fact, the settings are 9.5, 10.6 etc...the decimal places do not show up in the exported file. I've been going through the XML files and altering the entries for "Decimal Precision" but so far, no joy. The purpose of this little exercise is to be able to graph pressure, leak, and AI/AHI together to see if there is a relationship.NotMuffy wrote:What kind of "whole numbers" are you seeing? Are they like 3-digits?datguykirt wrote:Editing the ResScan XML Files to Show Me What I want
Sorry if this is a duplication but I did search, really I did.
I have the ResMed S9 Elite with the H5i heated humidifier and Nasal Pillow mask. I use ResScan 3.14 (the latest version as far as I know) to analyse the data from the data card. I recently started editing the XML files to get the program to show a little more data. What I have accomplished so far is getting it to export pressure info to a CSV file which I read with Excel. However, the data is limited to whole numbers in the CSV file, even though it is in 2-place decimals in the ResScan program.
So, 2 things I would like to be able to do. Export the Pressure data in 2 decimal place values and also to get ResScan to show the Flow Graph.
Any ideas out there?
"Don't Blame Me...You Took the Red Pill..."
Re: Editing the ResScan XML Files to Show Me What I want
So why do you want to do this? Once you run an unfiltered channel, you see EVERYTHING, including stuff like all the ballistocardiographic artifact:
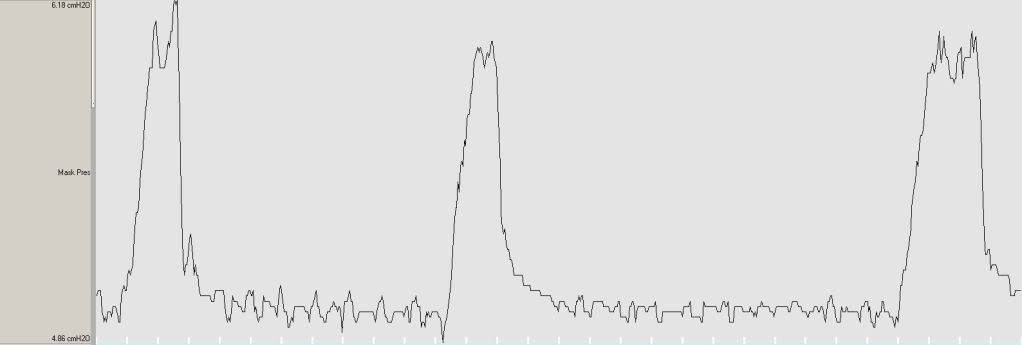
Unless, of course, you're into that kind of thing.
But I mean, there may be a point of too much stuff.
Unless, of course, you're into that kind of thing.
But I mean, there may be a point of too much stuff.
"Don't Blame Me...You Took the Red Pill..."
Re: Editing the ResScan XML Files to Show Me What I want
Why aren't the graphs in Resscan sufficient? Is it because you want to look at several days of data in one continuous graph, and not just one day at a time like Resscan shows. Or is because you can't seem to get the pressure graph to show in Resscan? If so, you may have a problem on your hands. Pressure and flow are sampled 25 times per second. That means in a 7 hour sleep time you will have 7 x 60 x 60 x 25 = 630,000 rows of data. I don't off hand what the limit is in newer versions of Excel, but my copy of Lotus 1-2-3 limits a page to 64,000 rows, meaning it takes 10 tabs to show all the data. If you want to look at 10 days of data in one graph you will have to have about 100 tabs. That amount of data can simply get to be quite unwieldy, I think, to look at with a spreadsheet.datguykirt wrote:I want to be able to graph Pressure, Leak, AI and AHI together over time to see if there is a relationship.
Maybe I'm wrong, and you can do it OK, but I'm skeptical.
On the download options box do you have the option checked to download all available data? Also, there is only seven days of high resolution data available on the SD card. If you check overwrite during the download process all high res data older than seven days, and all detail data older than 30 days, get deleted from the Resscan rlk files. At least that's what I saw the one time I selected overwrite.
I will tell you based on what data I have looked at from the daily graphs, and from a 30 day graph based on summary data, there is no clear correlation at all between leak rate below the threshold, and the number of events. I posted a graph a few weeks ago. Obviously there is correlation between pressure and events as that is the basis for determining what CPAP settings to use. And the very definition of apnea is based on flow rate so that correlation is established by definition.
I guess my feeling is you are engaged in an academic exercise of doubtful value, especially since you are having such frustration getting there. But, that's just my opinion, and I do like to look at data and look for correlations myself!
_________________
| Mask: AirFit™ P10 Nasal Pillow CPAP Mask with Headgear |
| Humidifier: S9™ Series H5i™ Heated Humidifier with Climate Control |
| Additional Comments: Hose management - rubber band tied to casement window crank handle! Hey, it works! S/W is 3.13, not 3.7 |
Re: Editing the ResScan XML Files to Show Me What I want
Here's the thread where I give my conclusion re: leak rate and OAI and CA.
viewtopic.php?f=1&t=62752&p=586529&hili ... on#p586529
My graph is based on the data from the str file for the 95% value and covers 5 months. A detailed minute by minute graphing may show some correlation. If that is what you are trying to go after, hats off to you. But like I wrote in the thread sometimes we get caught up in trying to capture clouds.
_________________
| Mask: AirFit™ P10 Nasal Pillow CPAP Mask with Headgear |
| Humidifier: S9™ Series H5i™ Heated Humidifier with Climate Control |
| Additional Comments: Hose management - rubber band tied to casement window crank handle! Hey, it works! S/W is 3.13, not 3.7 |
-
datguykirt
- Posts: 7
- Joined: Sat Jun 11, 2011 2:48 pm
- Location: Uuuummm...I'm right here!
Re: Editing the ResScan XML Files to Show Me What I want
The data downloads just fine into ResScan. I am not using the raw files. I do an Export right from ResScan to a CSV file which opens with Excel. The data from 2 months can be exported as a summary, not the detailed data. You can calculate the actual mask pressure by subtracting the result of the leak from the original flow data and then you can plot a graph showing actual pressure and AI/AHI. The majority of my apneas are central and I'm just trying to get a handle on all of the relationships and get a better understanding of the whole cause vs effect picture. Really...all I want to know is this. Does anyone know how to make the pressure figures export including the decimals?
_________________
| Mask | Humidifier | |||
| | |||
| Additional Comments: The software I use is actually the latest, ResScan 3.14 but that option was not available here. | ||||
Really? I showered and shaved for THIS?
Re: Editing the ResScan XML Files to Show Me What I want
I'm confused. How do you plan to do that? Flow and pressure both are dependent on fan speed and I'm absolutely sure that is constantly varying. There's no way to directly know what that is.datguykirt wrote:You can calculate the actual mask pressure by subtracting the result of the leak from the original flow data and then you can plot a graph showing actual pressure and AI/AHI.
The flow in the hi-res data is the actual flow after the leak and mask vent have been subtracted out by the S9. Likewise, the hi-res pressure number is the actual pressure at the mask, as closely as can be determined. Both are in the BRP file. Here's a quote from the Resmed data management guide.
The fact that the pressure is a number derived inside the S9 tells me that any attempt by a user to refine it is of questionable value. I presume you have looked at the BRP file with EDFBrowser. If so, you will see that the pressure is varying slightly in sync with the flow.Therapy Pressure
In CPAP mode, therapy pressure is the set CPAP pressure. In AutoSet mode, therapy pressure is the pressure derived by the AutoSet algorithm.
Flow
Flow is an estimate of the airflow entering the lungs. It is derived by taking the total flow and then removing the leak and mask vent flow components.
As far as the data exported from Resscan I'm sure it is nothing more than a copy of the data in the STR file, which does not contain flow and only the med, 95th%, and max pressure numbers. It's going to be difficult to meaningfully combine flow and pressure data with it. The detail data is in the PLD file and that is sampled every two seconds. There is no flow data in the PLD file.
So what are you trying to discern that is not already available in the raw data? Keep in mind Resscan does only three things: it combines multiple sessions for one day into one graph, it presents the data in a pretty fashion, and it scales some of the numbers. It does not do any number crunching. All that is done in the S9.
Are you selecting the File/Export menu item in Resscan? If so, that export is intended to provide compliance data. It's essentially useless for analyzing therapy activity.
_________________
| Mask: AirFit™ P10 Nasal Pillow CPAP Mask with Headgear |
| Humidifier: S9™ Series H5i™ Heated Humidifier with Climate Control |
| Additional Comments: Hose management - rubber band tied to casement window crank handle! Hey, it works! S/W is 3.13, not 3.7 |
15 posts
• Page 1 of 1