


Pressure Graphs v Pressure Stats sleepyhead


10 posts
• Page 1 of 1
Pressure Graphs v Pressure Stats sleepyhead
For last night, Sleepyhead shows my pressure at a maximum of 9.5...However, the graph for pressure shows that my pressure was well over 13 many times during the night and was rarely below 11. Am I reading this incorrectly or is something amiss?
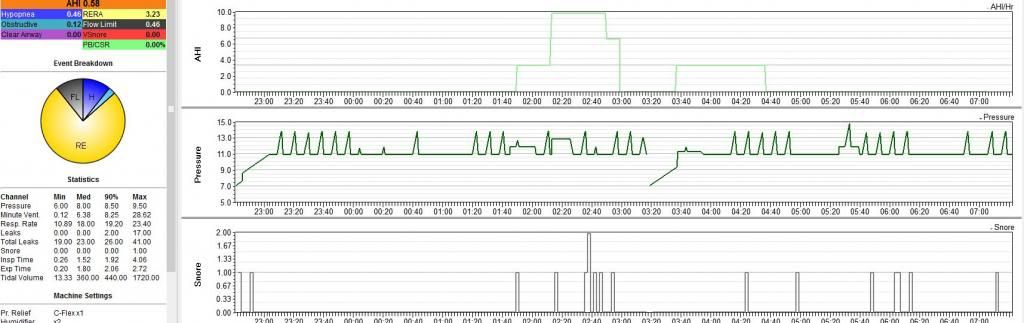
_________________
| Mask: Ultra Mirage™ Full Face CPAP Mask with Headgear |
| Additional Comments: 9.5/14 Pressure...Sleepyhead |

Re: Pressure Graphs v Pressure Stats sleepyhead
SleepyHead bug....check your previous nights and see if they are buggy also.
What are the pressure settings?...from the machine and not per software?
If all the prior nights are buggy too...go to Preferences in SleepyHead and then to appearance tab and remove the check mark for "use pixmap caching" and see if that fixes the discrepancy.
What are the pressure settings?...from the machine and not per software?
If all the prior nights are buggy too...go to Preferences in SleepyHead and then to appearance tab and remove the check mark for "use pixmap caching" and see if that fixes the discrepancy.
_________________
| Machine: AirCurve™ 10 VAuto BiLevel Machine with HumidAir™ Heated Humidifier |
| Additional Comments: Mask Bleep Eclipse https://bleepsleep.com/the-eclipse/ |
I may have to RISE but I refuse to SHINE.
Re: Pressure Graphs v Pressure Stats sleepyhead
Thanks Pugsy
Don't pretend to understand why, but that fixed it.
Don't pretend to understand why, but that fixed it.
_________________
| Mask: Ultra Mirage™ Full Face CPAP Mask with Headgear |
| Additional Comments: 9.5/14 Pressure...Sleepyhead |
Re: Pressure Graphs v Pressure Stats sleepyhead
hi there,
I have the same issue, but the "use pixmap caching" is already off; I have pressure set from 5 to 15:
this is 1/31/2014 - Min pressure is 12.30 but Med is 9.20:

this is 2/01/2014 - Min pressure is 9.70, but the graph shows points below it:

this is 2/04/2014 - Min pressure is 10.60, but Med is 9.00; the graph starts from 10:

I have fresh memory of the last one, and I don't remember having had a Min of 10.60....
yesterday I added the humidifier to my machine... don't know if this could have some impact or not.
thank you for your help.
I have the same issue, but the "use pixmap caching" is already off; I have pressure set from 5 to 15:
this is 1/31/2014 - Min pressure is 12.30 but Med is 9.20:
this is 2/01/2014 - Min pressure is 9.70, but the graph shows points below it:
this is 2/04/2014 - Min pressure is 10.60, but Med is 9.00; the graph starts from 10:
I have fresh memory of the last one, and I don't remember having had a Min of 10.60....
yesterday I added the humidifier to my machine... don't know if this could have some impact or not.
thank you for your help.
Re: Pressure Graphs v Pressure Stats sleepyhead
Try turning it back on again.matrello wrote: I have the same issue, but the "use pixmap caching" is already off;
Adding the humidifier isn't the problem. The problem is a SleepyHead bug.
Do you have Encore software available?
_________________
| Machine: AirCurve™ 10 VAuto BiLevel Machine with HumidAir™ Heated Humidifier |
| Additional Comments: Mask Bleep Eclipse https://bleepsleep.com/the-eclipse/ |
I may have to RISE but I refuse to SHINE.
Re: Pressure Graphs v Pressure Stats sleepyhead
I tried playing with "use pixmap caching" with no luck.
I compared the pressure numbers between Encore and SleepyHead:

as you can see, the difference with 90% and average values are acceptable; however, the minimun value - which is not reported in Encore - looks wrong. this is not an huge bug, though, as minimun is always supposed to be the lowest number in the pressure range (5 in my case).
I compared the pressure numbers between Encore and SleepyHead:
as you can see, the difference with 90% and average values are acceptable; however, the minimun value - which is not reported in Encore - looks wrong. this is not an huge bug, though, as minimun is always supposed to be the lowest number in the pressure range (5 in my case).
Re: Pressure Graphs v Pressure Stats sleepyhead
Anyone wanting to compare 90% Encore pressure value with SleepyHead value....be sure to set SleepyHead to do 90% calculations instead of the 95% default if you want it as close as possible.
_________________
| Machine: AirCurve™ 10 VAuto BiLevel Machine with HumidAir™ Heated Humidifier |
| Additional Comments: Mask Bleep Eclipse https://bleepsleep.com/the-eclipse/ |
I may have to RISE but I refuse to SHINE.
Re: Pressure Graphs v Pressure Stats sleepyhead
thank you, it's already set to 90%.
Re: Pressure Graphs v Pressure Stats sleepyhead
I've had some very strange and similar results. I posted a ticket on the sleepyhead sourceforge page - might want to add your data there so there's more to work with?
Re: Pressure Graphs v Pressure Stats sleepyhead
done: I've just added a link to this thread.
thank you.
thank you.
10 posts
• Page 1 of 1