


Understanding the pie chart comparison to graph


5 posts
• Page 1 of 1
Understanding the pie chart comparison to graph
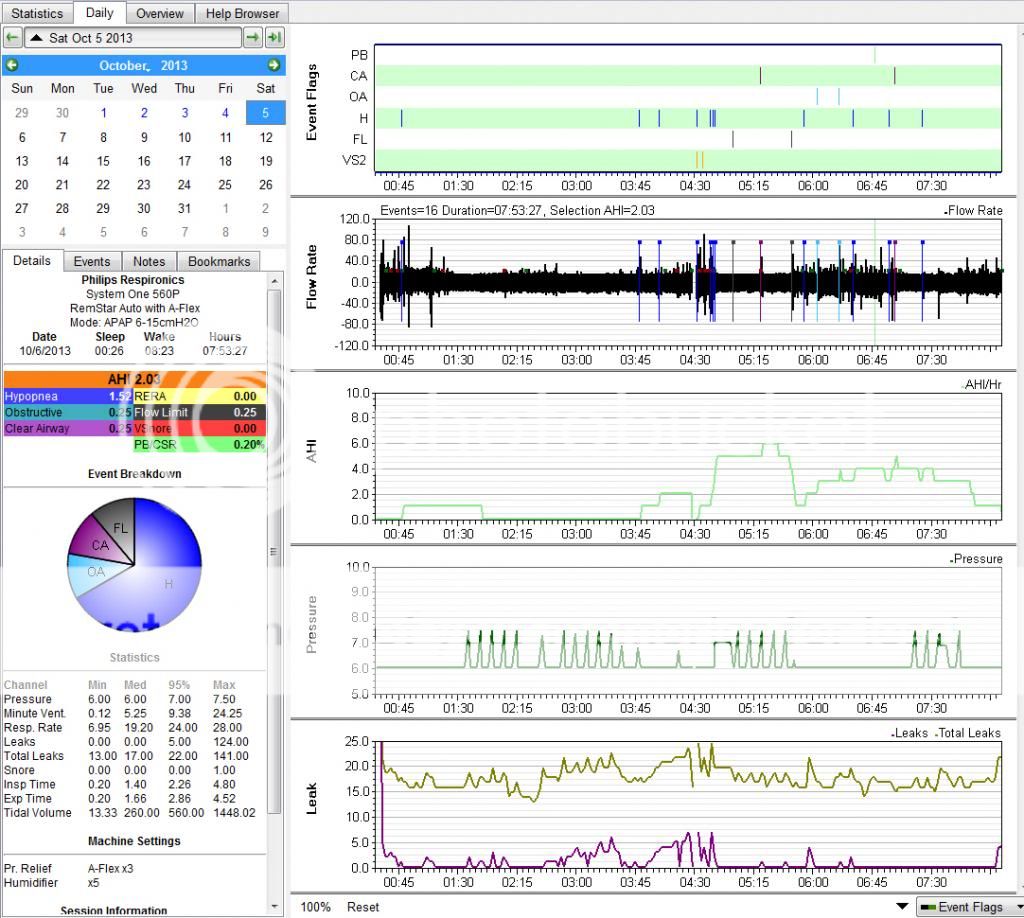
Just a bit curious why the pie chart the the left of the screen doesn't match the bar graph readings. The CA for the pie chows .25, yet the graph shows 2 event flags for CA. The pie shows 1.52 for the Hypoapea but event flags indicate 12 events. How does it determine this? Is it an average? Numbers looking ok? Should I kick up the pressure from 6.0 to 6.5 as a minimum to help the Hypoapnea a bit?
PR System One & Humidifier

Re: Understanding the pie chart comparison to graph
The pie chart is a whole pie and each slice of the pie is a percentage of the total of the various events flagged.
FLs and RERAs are part of the pie but not part of the AHI. If the night in question had not had any Fls then the pie segments would match up to whatever percentage each CA, Hyponea or Obstructive Apnea might be of the night.
You can increase the pressure if you wish but your Hypnoea index is well within acceptable limits as it is. There's no critical need though.
_________________
| Machine: AirCurve™ 10 VAuto BiLevel Machine with HumidAir™ Heated Humidifier |
| Additional Comments: Mask Bleep Eclipse https://bleepsleep.com/the-eclipse/ |
I may have to RISE but I refuse to SHINE.
Re: Understanding the pie chart comparison to graph
Thanks Pugsy! While I'm getting used to things and slowly feeling better after 15 years of issues, noticed my upper lip is a bugging me a bit and top front teeth. The mask isn't that tight, just a bit irritated. Small price to pay to begin to feel normal again
PR System One & Humidifier
-
enj@austin.rr.com
Re: Understanding the pie chart comparison to graph
Respironics System One REMstar Auto A-Flex with Humidifier..
Respironics REMstar Auto, DOM REF 560P S/N P09724564 6E8C and Humidifier DS6HFLG S/N H09724311 22AE
Just starting to use my machine and am anxious to see the daily results graphed...
Got to admit I'm and engineer and a computer freak...
I ran across this forum and thought maybe I could get pointed in the right direction...
Been using the system since 10/19 and have been through three different masks...
I believe I have one that works now, but have the nose bridge sore
I am manually reading the data every morning and collecting via spreadsheet... but what I see here there might some software available... I hope...
Your graphs look like they are plotting more than single point data for a day... hopefully I can see a better representation if I can read the SD Card and use Software...
I am using Win XP Pro... what software do you recommend...?
I've seen some for $99.00 but would like to know it is the best option...
Also, I have an SD Card reader... Do I need to buy another from Respironics... ?
I am slowly getting acclimated to the nightly changes but haven't seen any dramatic improvements the literature seems to promise...
Maybe in time...
Any input you may have would be appreciated...and since being a newbie, I am not sure I've asked all the right questions...
so please feel free to suggest ... based on your experience...
Thanks in advance...
Ed (newbie)
Have a good weekend...

Re: Understanding the pie chart comparison to graph
Look at the bottom of Pugsy's response and get the Sleepyhead software.
_________________
| Mask: Quattro™ FX Full Face CPAP Mask with Headgear |
| Additional Comments: Also on Oxygen while sleeping. |
Cheers,
Bill
Bill
5 posts
• Page 1 of 1