General Discussion on any topic relating to CPAP and/or Sleep Apnea.
-
stillsleepdeprived
- Posts: 5
- Joined: Tue Mar 13, 2012 5:43 pm
Post
by stillsleepdeprived » Wed Sep 05, 2012 8:13 pm
_________________
| Mask | |
 |
| Additional Comments: Sleepyhead Software 9.3, Remzzzs Mask Liners, Medium Mask |
-
Xney
- Posts: 842
- Joined: Fri Jul 20, 2012 6:53 pm
Post
by Xney » Wed Sep 05, 2012 11:04 pm
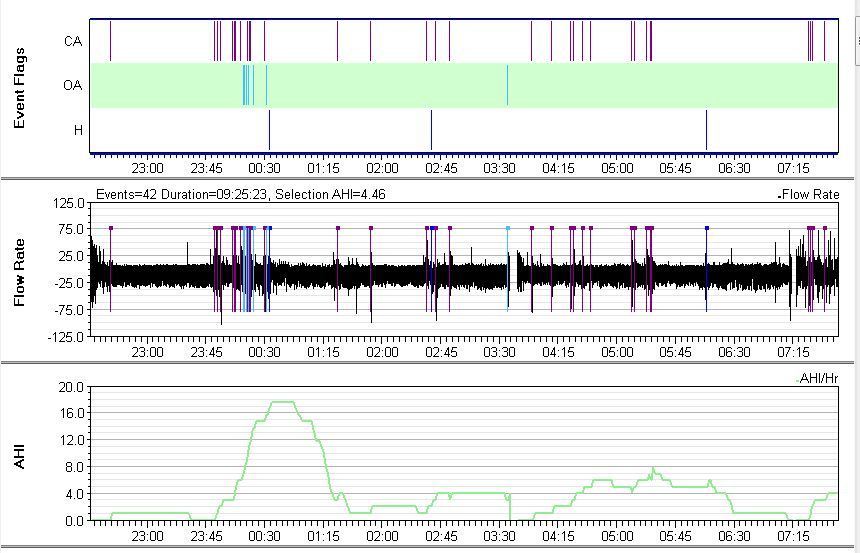
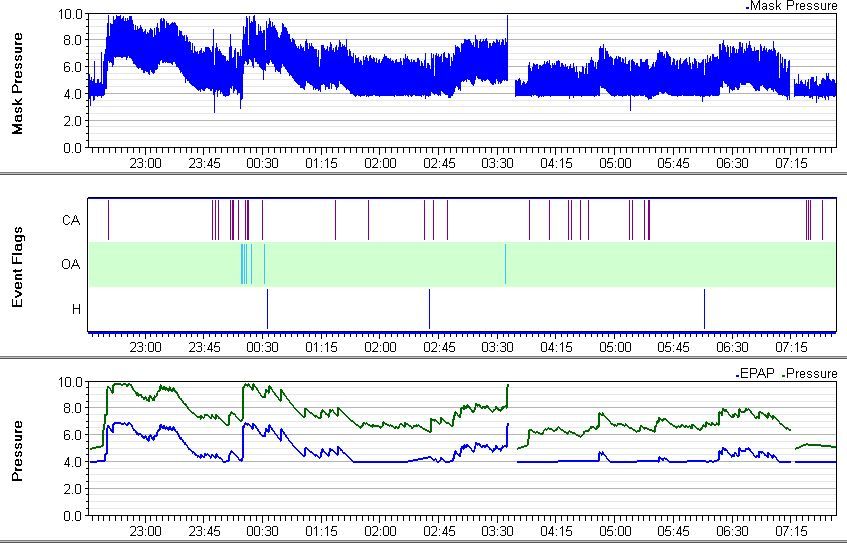
My interpretation: you're having too many events at pressures of 4-5cm, you need to set your minimum higher, at least 6.
I'd also consider bumping the top number to 12.
You are having centrals, which is something to watch out for with increasing pressure. However, your centrals (and obstructives) seem to be happening at the lower pressures so I think higher would help.