


Which parts of SleepyHead are best to be posted? If I counted right, there are 11 graphs for each night-I have only 2 nights plus a afternoon nap. To try to post all the graphs from both nights would be really a lot in one post-right? Are there specific graphs more important-give more critical data. I am going to try to post them again later but would like to get an idea which ones and both nights or just the last night??
Thanks
P
Which parts of SleepyHead to post?


4 posts
• Page 1 of 1
-
user from Singapore

- Posts: 190
- Joined: Sat May 12, 2012 12:12 am
- Location: Singapore
Re: Which parts of SleepyHead to post?
Hi Phil,
If I understood correctly, we must first see your leaks and pressure levels. Also the graph (normally on top) that reports how events are spread during the night.
You can select in SH which graphs you want to show or not.
Pugsy will certainly tell you more.
Did you see my reply in another thread on how to post your graphs? If you ignore all the kids fight among them, you should find it
Re: Which parts of SleepyHead to post?
From Singapore:
Yes, I saw your instructions about posting the graphs but I need to go back and re-read.
Thanks
Yes, I saw your instructions about posting the graphs but I need to go back and re-read.
Thanks

Re: Which parts of SleepyHead to post?
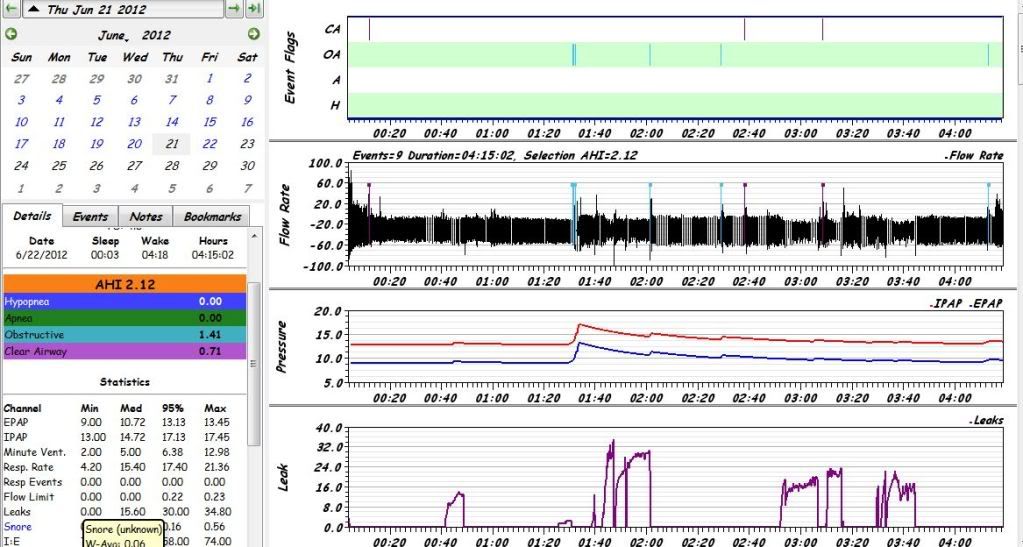
You can turn off the unneeded graphs and resize the main ones so that you can get them all on one screen.
If you use auto adjusting pressure then it is nice to see the pressure line..if you use a fixed pressure then it is not needed because we know it is fixed.
Main graphs I like to see...the top events graph, the flow graph, pressure line graph, leak line graph.
The rest of them put on the back burner for a while till you understand them and really the norms are so variable on some of that stuff that you have to look them up on the web anyway.
Here is an example of mine. It will be large and likely off screen but if you right click mouse over the image and choose "view image" you can then see it all.
_________________
| Machine: AirCurve™ 10 VAuto BiLevel Machine with HumidAir™ Heated Humidifier |
| Additional Comments: Mask Bleep Eclipse https://bleepsleep.com/the-eclipse/ |
I may have to RISE but I refuse to SHINE.
4 posts
• Page 1 of 1