I did a ton of research before getting my equipment and knew that I wanted the ResMed S9 AutoSet. Having read so many horror stories about dealing with DMEs, I made sure my Rx specified the exact machine I wanted. I actually had a pretty good experience with my DME (BP Gamma in Maryland)- they gave me everything I asked for without any hassle. Luckily for me, my insurance covers everything 100%.
I’ve had two nights with the machine, and things are going OK so far. I’m a stomach and side sleeper, and I toss and turn a lot, so I keep knocking the mask out of place. I managed to keep it on all night, though. Also, I have rosacea, and the mask is really irritating my skin where it touches my face. I’m not sure how I can go to work with a big, painful red triangle around my nose. I’m thinking I need a nasal pillow mask instead, since there would be less touching my face that way. I am going to try making a mask liner tonight and see if that helps.
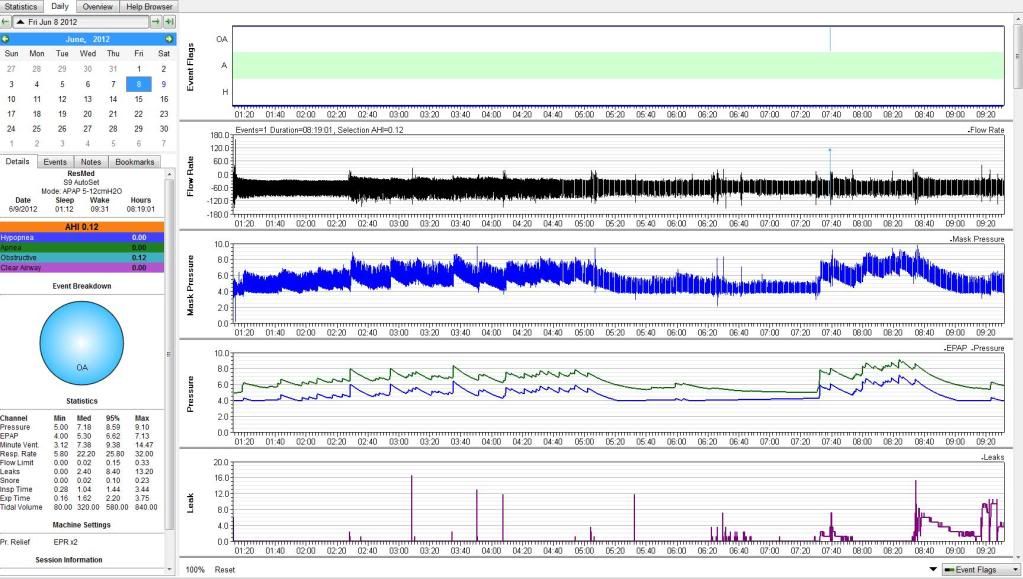
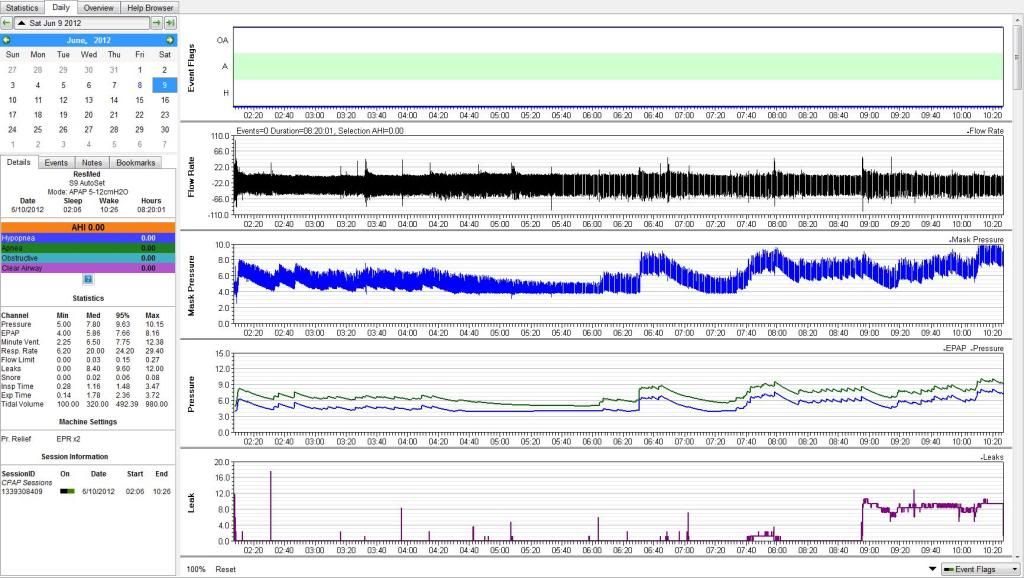
I’m a statistician, so looking at the data is really fun for me. I would have been so bummed out if my machine didn’t have full data capabilities. My numbers for the two nights are good, so I should be happy. I don’t feel any less tired, but I know for some people it takes longer to feel better, so I’m trying to be patient.
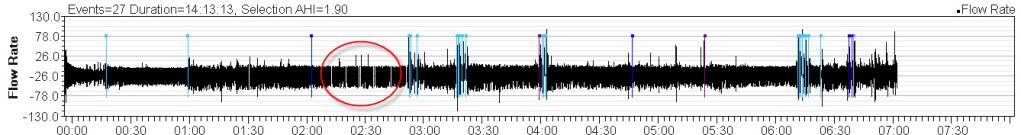
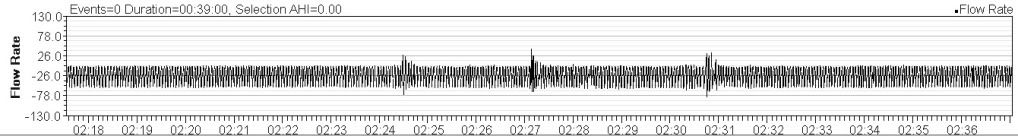
I do have a question about the graphs from SleepyHead. I’m looking at the flow rate graph, and after about 4 hours, there start to be lines where it looks like there was no flow, even though no event was recorded. Except for the first few, they seem to be pretty evenly spaced.
Here is the first night:
And here is the second night:
What’s really weird is that the lines match up exactly between the two nights. In the following image, the bottom half (below the red line) is from my first night and the top half is from my second night.
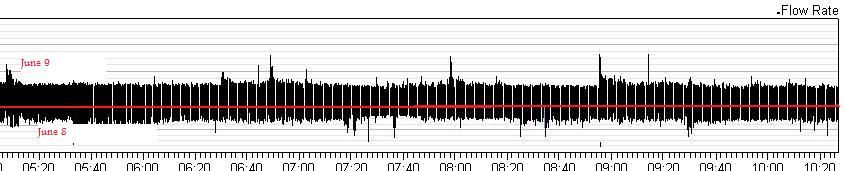
Does anyone know what they are? I assumed that they were times when my flow was limited, but not for long enough to qualify as an apnea/hypopnea, but the fact that they line up exactly seems weird to me.
Thanks!