Help interpreting oximetry data

General Discussion on any topic relating to CPAP and/or Sleep Apnea.
bombadil
Posts: 19
Joined: Sat Aug 27, 2011 1:15 pm

Help interpreting oximetry data

Post by bombadil » Fri Oct 21, 2011 11:58 am

Last night I recorded my first set of oximetry, and I'd be grateful if some of the more experienced people here could take a look and tell me whether my interpretation seems right. Unfortunately, I don't have the data card for the VPAP, so I can't compare with its data. Here's the full dataset:

Image

The anomalies around 3:30, 5:00, 6:00 and 7:50 correspond to times when I got up for a bathroom break, and the oximeter gives spurious data when I'm walking around with it, so I think they can be ignored.

The anomaly around 5:30 looks real to me, with a spike in heart rate corresponding to a dip in O2. Here's a close-up:

Image

Any comments or advice would be appreciated. Thanks very much.

_________________
Mask: Quattro™ FX Full Face CPAP Mask with Headgear
Additional Comments: Contac CMS 50-F oximeter

moresleep
Posts: 371
Joined: Sun Jul 24, 2011 12:14 am

Re: Help interpreting oximetry data

Post by moresleep » Fri Oct 21, 2011 12:17 pm

While only those three desaturation events drop O2 below 88%, it still looks like there are many other desats where O2 dropped more than 4% from the baseline (for some reason, 4% is usually considered significant).

You are probably right about the 5:30 event. It looks real, because after O2 came down, it went up significantly above the baseline, which is what you would expect if you experienced the desat due to an apneic event. That is, you stopped breathing and O2 went down; you started breathing again and hyperventilating, and O2 spiked high because of the hyperventilation.

You need to get that memory card, so that you can correlate the data from the Cpap with the oximetric data. Only then, will you be able to put much of a picture together.

jules
Posts: 3304
Joined: Mon Nov 27, 2006 10:51 pm

Re: Help interpreting oximetry data

Post by jules » Fri Oct 21, 2011 12:36 pm

if you see a piece of gray on the graphs before an "event" that is a lost signal / disconnect

look closely at the event between 5:25 and 5:26

bombadil
Posts: 19
Joined: Sat Aug 27, 2011 1:15 pm

Re: Help interpreting oximetry data

Post by bombadil » Fri Oct 21, 2011 12:50 pm

Thanks, jules, I see that now. So do you think this apparent apneic event is really just a lost signal? What do we make of the fact that the O2 appears to spike after it?

_________________
Mask: Quattro™ FX Full Face CPAP Mask with Headgear
Additional Comments: Contac CMS 50-F oximeter

jules
Posts: 3304
Joined: Mon Nov 27, 2006 10:51 pm

Re: Help interpreting oximetry data

Post by jules » Fri Oct 21, 2011 12:57 pm

when the signal is regained the value isn't always the right one - just like when you first put it on - it takes time to home in on the right value

HoseCrusher
Posts: 2744
Joined: Tue Oct 12, 2010 6:42 pm

Re: Help interpreting oximetry data

Post by HoseCrusher » Fri Oct 21, 2011 1:43 pm

The spike at 5:30 is an artifact.

Of interest are the spikes in pulse rate at 2:15, 4:00, 4:45, 9:00 and 9:30. You will have to zoom in on those areas and see what your O2 is doing.

I would suggest that you set up some 10 minute windows for viewing your data and see what is going on when your O2 levels drop below 90%.

The report page should also give you some statistics.

Overall, it was not a real bad night, but the goal is to see more of a pattern like you had from 1:00 to 3:00.

_________________
Mask: Brevida™ Nasal Pillow CPAP Mask with Headgear
Additional Comments: Machine is an AirSense 10 AutoSet For Her with Heated Humidifier.
SpO2 96+% and holding...

User avatar
Lizistired
Posts: 2835
Joined: Tue Dec 14, 2010 10:47 pm
Location: Indiana

Re: Help interpreting oximetry data

Post by Lizistired » Fri Oct 21, 2011 3:34 pm

Good start. When you view your data, zoom into any questionable areas in a 10 minute window. Then if you right click and select those areas where the unit lost the reading(grey line), it will block them out in grey and remove that data from your report.

_________________
Humidifier: S9™ Series H5i™ Heated Humidifier with Climate Control
Additional Comments: Swift FX sometimes, CMS-50F, Cervical collar sometimes, White noise, Zeo... I'm not well, but I'm better.

moresleep
Posts: 371
Joined: Sun Jul 24, 2011 12:14 am

Re: Help interpreting oximetry data

Post by moresleep » Fri Oct 21, 2011 6:44 pm

Jules, HoseCrusher, where do you see the grey before the 5:30 event? I'm just not seeing it--maybe my monitor or eyes...

bombadil
Posts: 19
Joined: Sat Aug 27, 2011 1:15 pm

Re: Help interpreting oximetry data

Post by bombadil » Fri Oct 21, 2011 6:50 pm

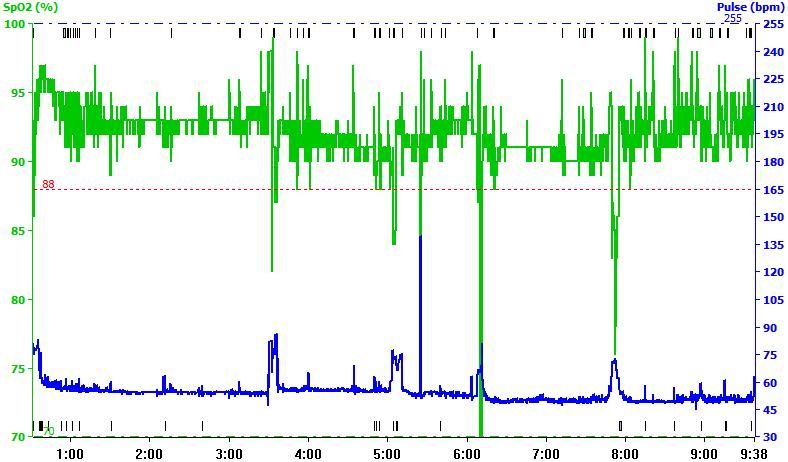
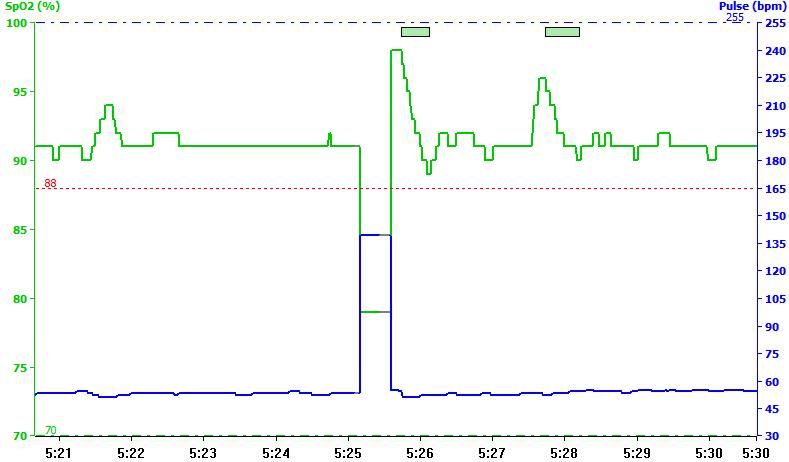
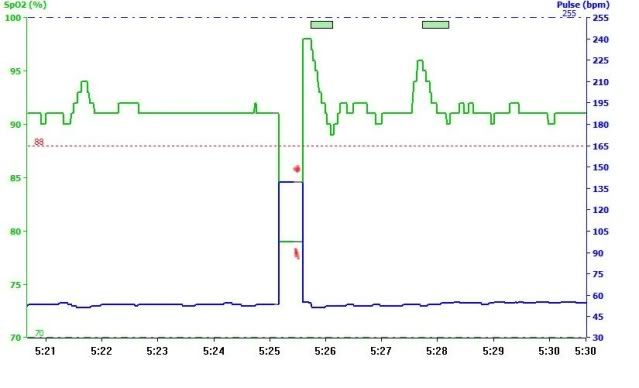
Thanks to all for the helpful posts. HoseCrusher, I've expanded the sections you suggested, along with a couple more where the O2 level drops below 90%. I'll give my novice interpretation of these, and if you or anyone else can explain them better, please do:

Image

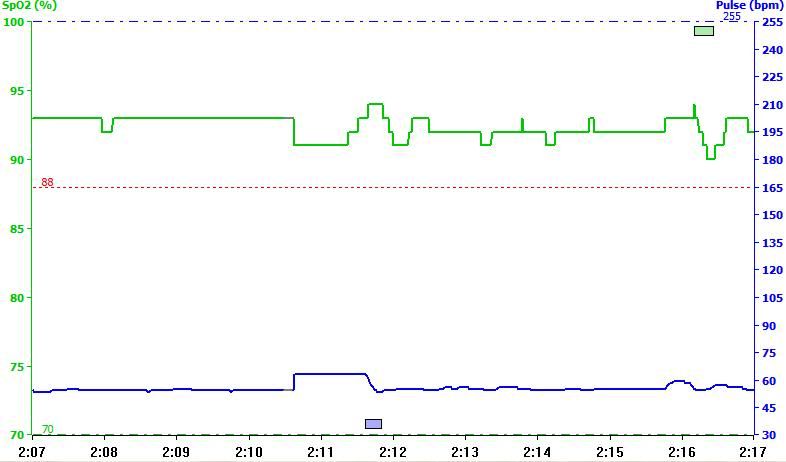
2:11 Looks to me like the pulse jumped up when the O2 dropped.

Image

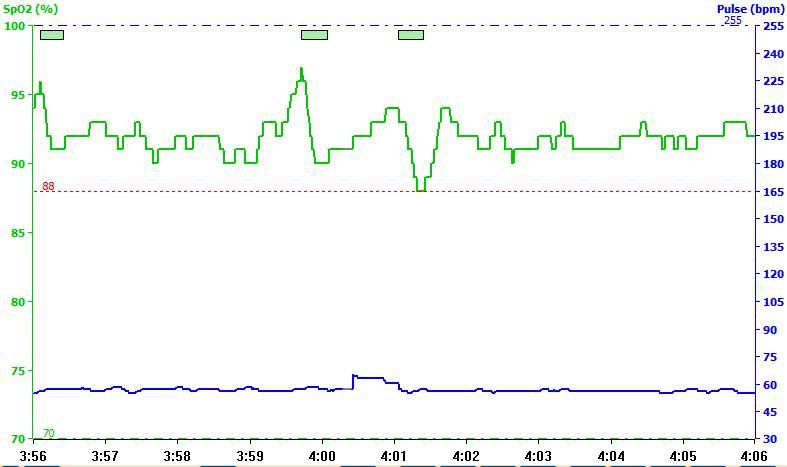
4:01 If there's a correlation here, I don't understand it. The pulse spikes *before* the O2 goes below 90.

Image

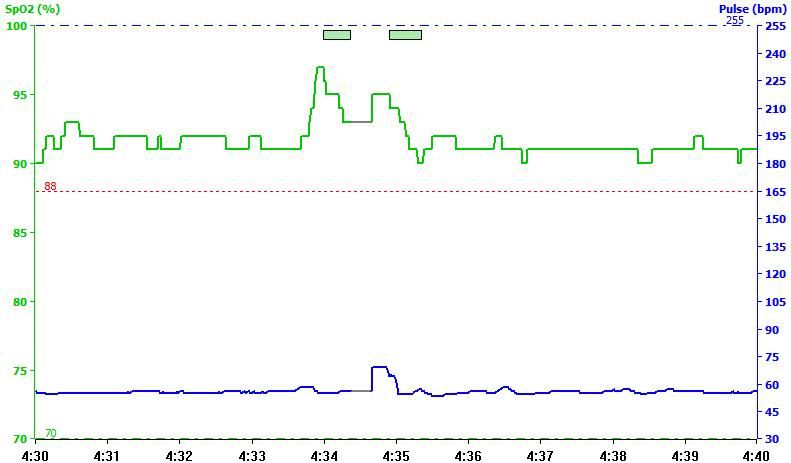
4:34 Also here, the pulse spikes while the O2 is spiking, and before the local minimum in O2.

Image

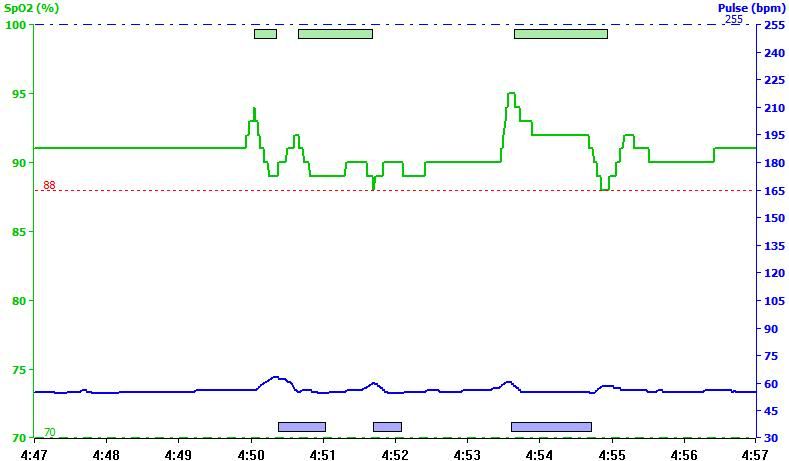
4:50-4:55 Most of the pulse spikes correspond to O2 drops.

Image

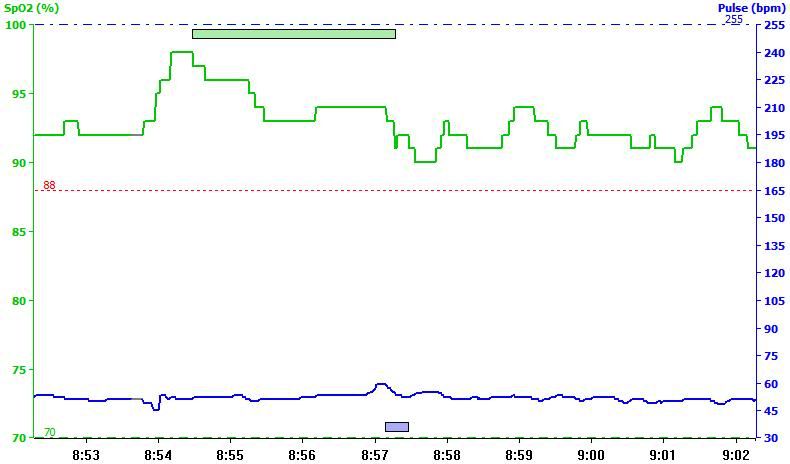
8:57 The pulse spikes slightly before the O2 minimum. We've seen this several times now. I wonder if the two curves are imperfectly correlated with the time axis.

Image

9:15 The pulse spikes just as the O2 minimum ends.

Image

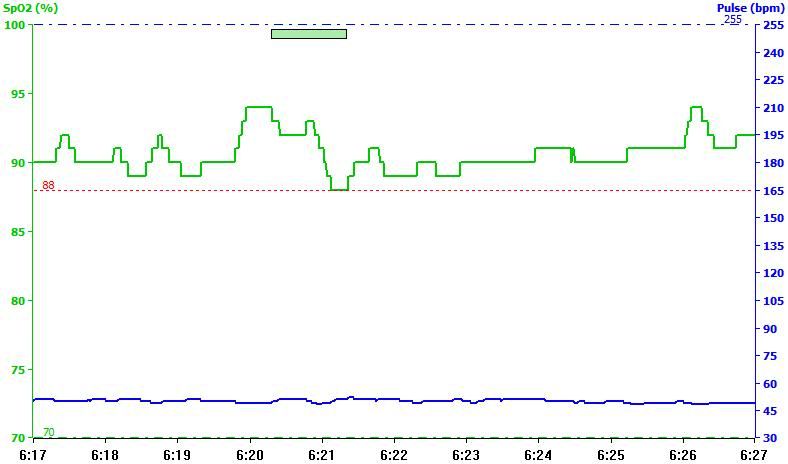
6:21This O2 dip below 90 doesn't have a corresponding pulse spike.

Image

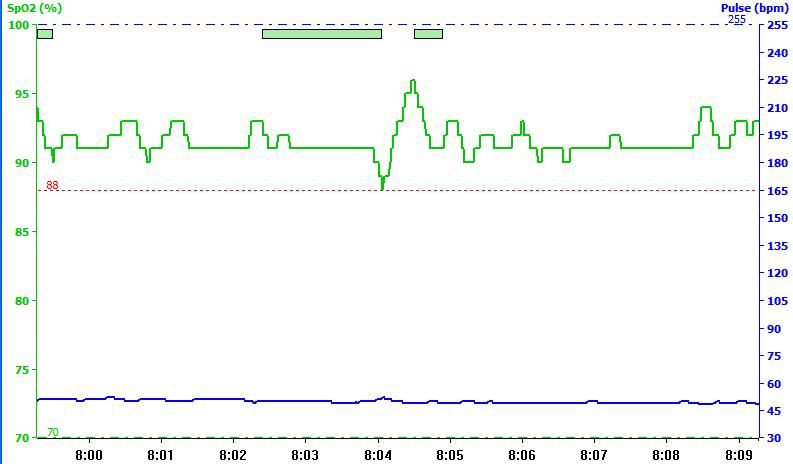
8:04 This O2 drop below 90 doesn't seem to have a feature (or maybe only a very small one) corresponding to it in the pulse data.

I realize the VPAP data would add a lot to the interpretation. I've downloaded the ResScan software and will be getting a null modem cable so I can download from the VPAP.

Also, you mentioned a report page. I don't see how to get to a report page from the SP02 software. What am I missing?

Thanks again.

_________________
Mask: Quattro™ FX Full Face CPAP Mask with Headgear
Additional Comments: Contac CMS 50-F oximeter

bombadil
Posts: 19
Joined: Sat Aug 27, 2011 1:15 pm

Re: Help interpreting oximetry data

Post by bombadil » Fri Oct 21, 2011 6:54 pm

Lizistired wrote:Good start. When you view your data, zoom into any questionable areas in a 10 minute window. Then if you right click and select those areas where the unit lost the reading(grey line), it will block them out in grey and remove that data from your report.
Thanks. That worked. I still haven't found the report, though.

_________________
Mask: Quattro™ FX Full Face CPAP Mask with Headgear
Additional Comments: Contac CMS 50-F oximeter

bombadil
Posts: 19
Joined: Sat Aug 27, 2011 1:15 pm

Re: Help interpreting oximetry data

Post by bombadil » Fri Oct 21, 2011 6:55 pm

moresleep wrote:Jules, HoseCrusher, where do you see the grey before the 5:30 event? I'm just not seeing it--maybe my monitor or eyes...
The grey is the rightmost half of the horizontal line between the two vertical lines on the second graph in my first post.

_________________
Mask: Quattro™ FX Full Face CPAP Mask with Headgear
Additional Comments: Contac CMS 50-F oximeter

bombadil
Posts: 19
Joined: Sat Aug 27, 2011 1:15 pm

Re: Help interpreting oximetry data

Post by bombadil » Fri Oct 21, 2011 7:02 pm

And now I've found where to see the report -- in the print option.

_________________
Mask: Quattro™ FX Full Face CPAP Mask with Headgear
Additional Comments: Contac CMS 50-F oximeter

jules
Posts: 3304
Joined: Mon Nov 27, 2006 10:51 pm

Re: Help interpreting oximetry data

Post by jules » Fri Oct 21, 2011 7:03 pm

report is the printer icon on the far bottom right - there are several options - I just open it up and look - never print them

again look for those gray areas on the graphs -( there is also marking above the graph for the O2 events - those horizontal green bars and blue bars at the bottom for pulse events) - other areas where there are gray areas on graph for disconnects are artifacts

between 4:00 and 4:01 is an artifact - see the gray segment on the graph?

on the far left bottom is an icon with a wrench on it which allows you to change what constitutes an event and what is the red O2 cut off -

visit pulseoxstore.com and look at the things he has posted there

User avatar
Lizistired
Posts: 2835
Joined: Tue Dec 14, 2010 10:47 pm
Location: Indiana

Re: Help interpreting oximetry data

Post by Lizistired » Fri Oct 21, 2011 7:04 pm

bombadil wrote:
Lizistired wrote:Good start. When you view your data, zoom into any questionable areas in a 10 minute window. Then if you right click and select those areas where the unit lost the reading(grey line), it will block them out in grey and remove that data from your report.
Thanks. That worked. I still haven't found the report, though.
Good, Select the oximetry report, it will give you more info. But don't bother until you have blocked out all the grey areas.

_________________
Humidifier: S9™ Series H5i™ Heated Humidifier with Climate Control
Additional Comments: Swift FX sometimes, CMS-50F, Cervical collar sometimes, White noise, Zeo... I'm not well, but I'm better.

jules
Posts: 3304
Joined: Mon Nov 27, 2006 10:51 pm

Re: Help interpreting oximetry data

Post by jules » Fri Oct 21, 2011 7:15 pm

moresleep wrote:Jules, HoseCrusher, where do you see the grey before the 5:30 event? I'm just not seeing it--maybe my monitor or eyes...

I put reddish dots by them - you can also see the line isn't quite as wide there either


Image