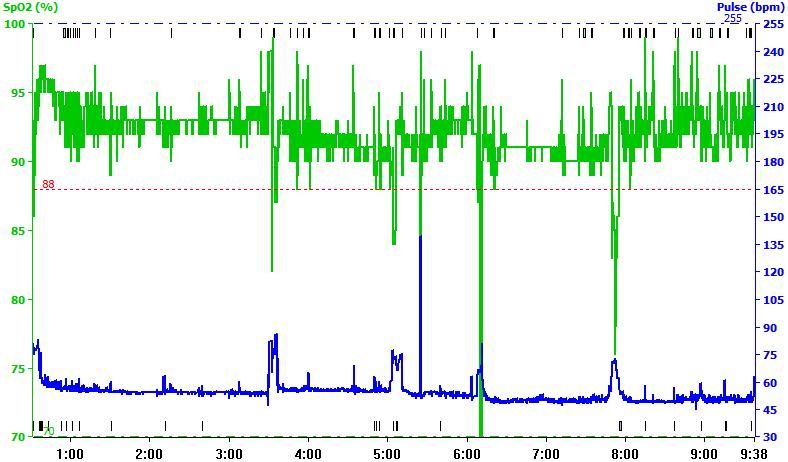
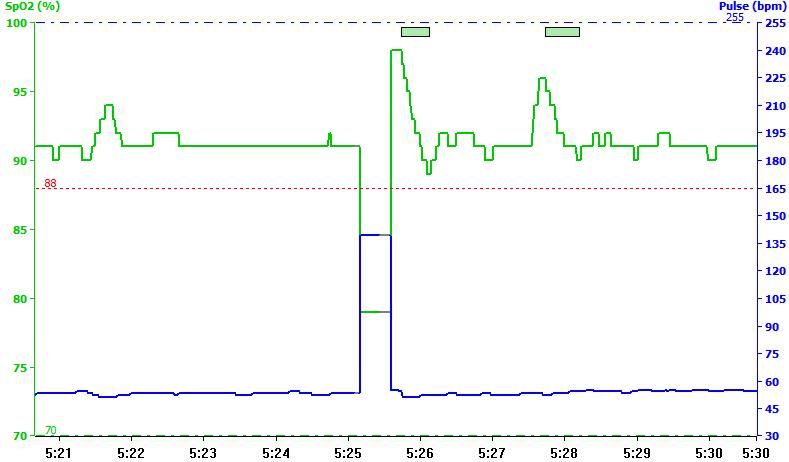
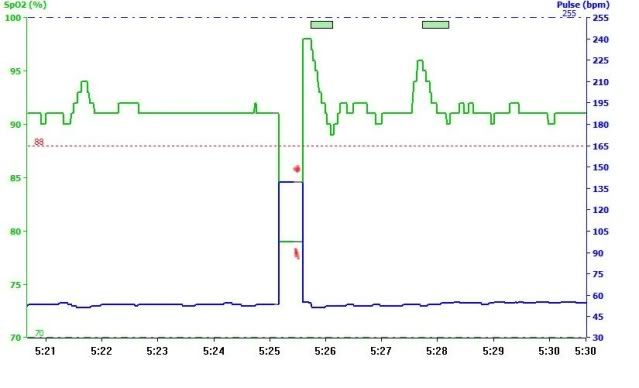
Thanks to all for the helpful posts. HoseCrusher, I've expanded the sections you suggested, along with a couple more where the O2 level drops below 90%. I'll give my novice interpretation of these, and if you or anyone else can explain them better, please do:

2:11 Looks to me like the pulse jumped up when the O2 dropped.

4:01 If there's a correlation here, I don't understand it. The pulse spikes *before* the O2 goes below 90.
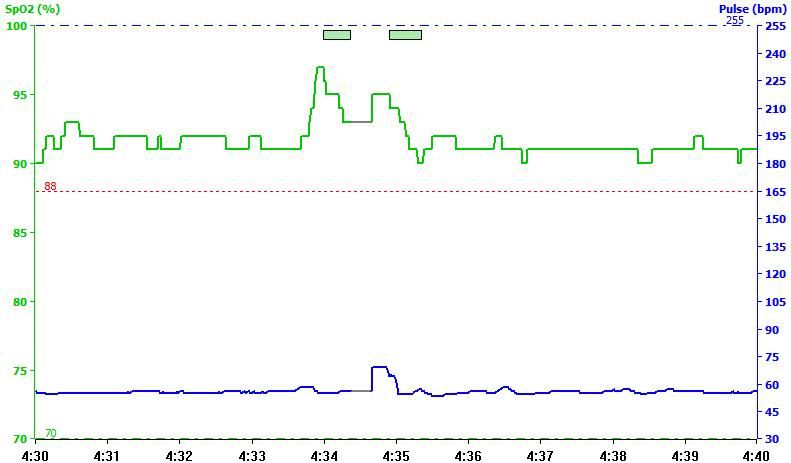
4:34 Also here, the pulse spikes while the O2 is spiking, and before the local minimum in O2.

4:50-4:55 Most of the pulse spikes correspond to O2 drops.
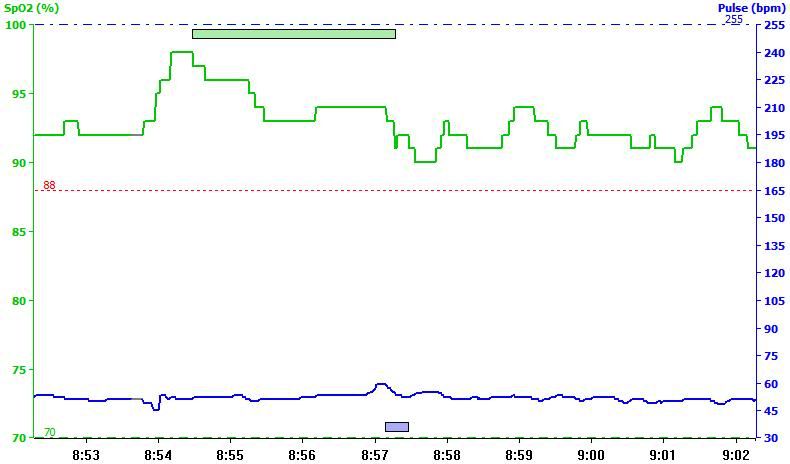
8:57 The pulse spikes slightly before the O2 minimum. We've seen this several times now. I wonder if the two curves are imperfectly correlated with the time axis.

9:15 The pulse spikes just as the O2 minimum ends.
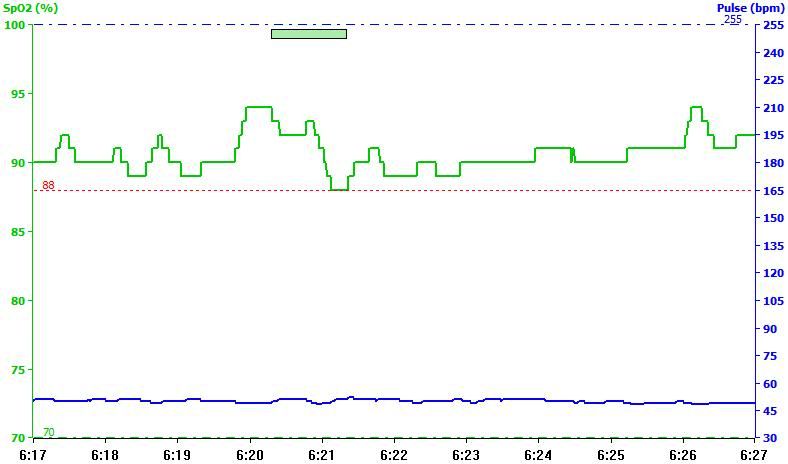
6:21This O2 dip below 90 doesn't have a corresponding pulse spike.
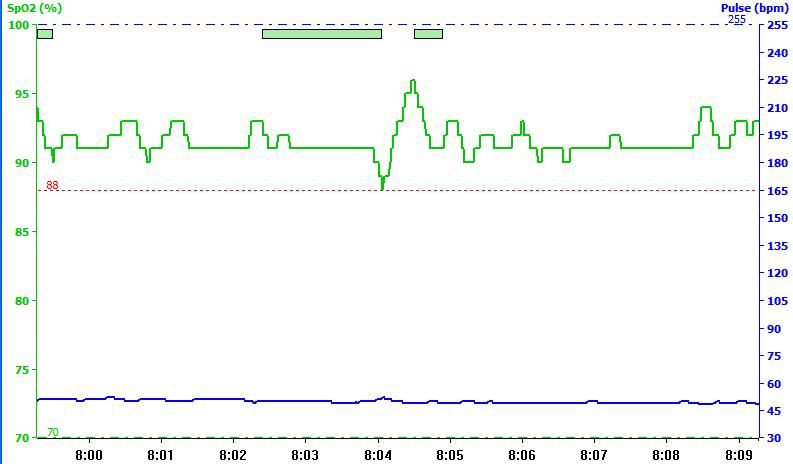
8:04 This O2 drop below 90 doesn't seem to have a feature (or maybe only a very small one) corresponding to it in the pulse data.
I realize the VPAP data would add a lot to the interpretation. I've downloaded the ResScan software and will be getting a null modem cable so I can download from the VPAP.
Also, you mentioned a report page. I don't see how to get to a report page from the SP02 software. What am I missing?
Thanks again.
