AHI Graph question
- russellms76
- Posts: 19
- Joined: Tue May 10, 2011 6:50 am
AHI Graph question
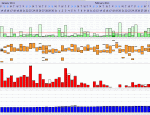
I've noticed a trend in my AHI graph data. AHI slowly ramps up from 0 to 6,7, or 8 over an hour then on the hour (1am, 2am, 3am) it drops back down to 0. Small PDF file is at URL below.
I would guess either my S8 AutoSet II has a defect in this module hardware or software, or my AHI is tied to some external stimulus such as a clock that chimes every hour in our house. All other readings appear normal. This pattern is repeated nightly. Notice also how the graphs flatline. That doesn't seem correct either.
Anybody else seen anything like this?
http://www.idatek.com/apnea/AHI.pdf
Re: AHI Graph question
Question for you? During your sleep study did they mention whether you happen to be worse (more events) during REM sleep?
Also could you post the AHI graph itself? The one showing the groupings and little squares with numbers at the top showing how long the events lasted. This would let us see how the events tend to be grouped.
Also could you post the AHI graph itself? The one showing the groupings and little squares with numbers at the top showing how long the events lasted. This would let us see how the events tend to be grouped.
_________________
| Machine: AirCurve™ 10 VAuto BiLevel Machine with HumidAir™ Heated Humidifier |
| Additional Comments: Mask Bleep Eclipse https://bleepsleep.com/the-eclipse/ |
I may have to RISE but I refuse to SHINE.
If you want to try the Eclipse mask and want a special promo code to get a little off the price...send me a private message.
If you want to try the Eclipse mask and want a special promo code to get a little off the price...send me a private message.
- russellms76
- Posts: 19
- Joined: Tue May 10, 2011 6:50 am
Re: AHI Graph question
The only numbers on my graphs are for Apnea and Hypopnea events, not AHI. I've posted another file (ahi2.pdf).
I'll look as my ResScan Deatiled data again to see if I'm missing something. Thanks for looking.
http://www.idatek.com/apnea/AHI2.pdf
I'll look as my ResScan Deatiled data again to see if I'm missing something. Thanks for looking.
http://www.idatek.com/apnea/AHI2.pdf
Re: AHI Graph question
What you are seeing in the AHI graph data is the number of events per hour. So at the beginning of every hour, you have 0 events. As events occur, ResScan plots them. For example, notice that between midnight (00:00) and 01:00, you have four Events: three hypos and one OBS of 16 seconds. When you correlate that with your AHI graph, you see that the graph starts at 0 (flat line) and rises to 4 on the events/hr scale. It's just a fast way to count events for each hour so you don't have to manually count the events from the Events graph.
_________________
| Mask: Swift™ FX Nasal Pillow CPAP Mask with Headgear |
| Humidifier: S9™ Series H5i™ Heated Humidifier with Climate Control |
| Additional Comments: Gear: PapCap |
"All that is very well," answered Candide; "but let us cultivate our garden."
Voltaire, Candide, last line.
Voltaire, Candide, last line.
Re: AHI Graph question
The Event Graph, that is the one I was thinking of, couldn't remember the name. I don't see a typical REM (maybe) pattern to explain the increase in events in the wee hours of the morning. Though it is still possible or could even maybe positional. You seem to have mainly Hyponeas which is fairly common for the ResMed S8 machines. It is common to have more events in REM and even sleeping on your back. Since we normally have more REM in the wee hours of the morning, it could explain some of those events. You would need to correlate that idea with your history in the sleep study.
The first graph in question is indeed just what Bodhi has said and what you are seeing is normal way of reporting and there is nothing wrong with software or the machine.
The first graph in question is indeed just what Bodhi has said and what you are seeing is normal way of reporting and there is nothing wrong with software or the machine.
_________________
| Machine: AirCurve™ 10 VAuto BiLevel Machine with HumidAir™ Heated Humidifier |
| Additional Comments: Mask Bleep Eclipse https://bleepsleep.com/the-eclipse/ |
I may have to RISE but I refuse to SHINE.
If you want to try the Eclipse mask and want a special promo code to get a little off the price...send me a private message.
If you want to try the Eclipse mask and want a special promo code to get a little off the price...send me a private message.
Re: AHI Graph question
Bondi has it completely correct: In the ResScan software, that AHI in the AHI graph is reset to 0 on the hour every hour. Why? Well AHI is the number of apneas and hypopneas that occur in an hour. Hence once the hour is up, the AHI drops to zero to count the anpeas and hypopneas in the NEXT hour.
The AHI reported in the summary data for the night and the AHI reported on the S9's LCD, however, are averaged over the whole night. In other words, they are computed by dividing the total number of events for the night by the time in hours the machine was running.
The AHI reported in the summary data for the night and the AHI reported on the S9's LCD, however, are averaged over the whole night. In other words, they are computed by dividing the total number of events for the night by the time in hours the machine was running.
_________________
| Machine: DreamStation BiPAP® Auto Machine |
| Mask: Swift™ FX Nasal Pillow CPAP Mask with Headgear |
| Additional Comments: PR System DreamStation and Humidifier. Max IPAP = 9, Min EPAP=4, Rise time setting = 3, minPS = 3, maxPS=5 |
-
Guest
Re: AHI Graph question
Resetting the AHI to zero on the clock's hour is an artificiality. Apparently the software engineers who wrote ResScan have no idea how to present the AHI as the number of events in the past hour, whenever that hour starts, at each point of time on the graph. This is a dead simple programming matter.
It's a wonder to me that someone hasn't provided a ResScan alternative that avoids problems like this.
It's a wonder to me that someone hasn't provided a ResScan alternative that avoids problems like this.
-
Guest
Re: AHI Graph question
ok, that makes sense and explains why the flat line at the top of the chart between each hour., ie. no more events that hour. Looking at the Clinical guide, it describes AHI measured by:"...calculated values per usage hour per session,..."
- Breathe Jimbo
- Posts: 954
- Joined: Sun Sep 12, 2010 3:02 pm
- Location: Pasadena, CA
Re: AHI Graph question
I find the AHI graph to be quite useless. The events graph and the AHI statistic for the entire night are more significant.
_________________
| Mask: Swift™ LT Nasal Pillow CPAP Mask with Headgear |
| Humidifier: S9™ Series H5i™ Heated Humidifier with Climate Control |
| Additional Comments: Since 9/9/10; 13 cm; ResScan 3.16; SleepyHead 0.9; PapCap |
- Lizistired
- Posts: 2835
- Joined: Tue Dec 14, 2010 10:47 pm
- Location: Indiana
Re: AHI Graph question
Ditto. I think the report function is just as useless. You can get more information on a screenshot.Breathe Jimbo wrote:I find the AHI graph to be quite useless. The events graph and the AHI statistic for the entire night are more significant.
_________________
| Mask: Swift™ LT Nasal Pillow CPAP Mask with Headgear |
| Humidifier: S9™ Series H5i™ Heated Humidifier with Climate Control |
| Additional Comments: Swift FX sometimes, CMS-50F, Cervical collar sometimes, White noise, Zeo... I'm not well, but I'm better. |
ResScan: http://www.resmed.com/int/assets/html/s ... c=patients
ResScan Tutorial- http://montfordhouse.com/cpap/resscan_tutorial/
Machines Video: http://www.cpaplibrary.com/machine-education
ResScan Tutorial- http://montfordhouse.com/cpap/resscan_tutorial/
Machines Video: http://www.cpaplibrary.com/machine-education
- Jay Aitchsee
- Posts: 2936
- Joined: Sun May 22, 2011 12:47 pm
- Location: Southwest Florida
Re: AHI Graph question
Re: http://www.idatek.com/apnea/AHI2.pdf
Do I have this right? From Russell's Data in the hour from 0000 to 0100, he had 5 total events: 4 hypopneas and 1 apnea, the apnea lasting for 16 seconds? That would fit well with the flat topped portion of his AHI vs events per hour graph for the same period. The only problem is that doesn't work for the next hour. From 0100 to 0200 his AHI rises to about 18, but his events graph only shows 6 events, 4 hypopneas and 2 apneas. Obviously, I'm missing something. Just got my ResScan running, and I too am trying to make sense of the data. I haven't found the manual to be much help.
Thanks,
_________________
| Mask: AirFit™ P10 Nasal Pillow CPAP Mask with Headgear |
| Additional Comments: S9 Auto, P10 mask, P=7.0, EPR3, ResScan 5.3, SleepyHead V1.B2, Windows 10, ZEO, CMS50F, Infrared Video |
Re: AHI Graph question
I would suspect that the hour from 0100 to 0200 has several hyponeas very close together and on this one graph give the appearance of being a single event. They are probably overlapping in this particular graph. The software does allow for a person to choose an area of the graph and "zoom" in and get a more detailed graph of that one particular hour if they wanted to. Even to 15 minutes or less.Jay Aitchsee wrote:Do I have this right? From Russell's Data in the hour from 0000 to 0100, he had 5 total events: 4 hypopneas and 1 apnea, the apnea lasting for 16 seconds? That would fit well with the flat topped portion of his AHI vs events per hour graph for the same period. The only problem is that doesn't work for the next hour. From 0100 to 0200 his AHI rises to about 18, but his events graph only shows 6 events, 4 hypopneas and 2 apneas. Obviously, I'm missing something. Just got my ResScan running, and I too am trying to make sense of the data. I haven't found the manual to be much help.
Thanks,
There is a tutorial which explains this and the software features.
http://montfordhouse.com/cpap/resscan_tutorial/
_________________
| Machine: AirCurve™ 10 VAuto BiLevel Machine with HumidAir™ Heated Humidifier |
| Additional Comments: Mask Bleep Eclipse https://bleepsleep.com/the-eclipse/ |
I may have to RISE but I refuse to SHINE.
If you want to try the Eclipse mask and want a special promo code to get a little off the price...send me a private message.
If you want to try the Eclipse mask and want a special promo code to get a little off the price...send me a private message.


