A Test of my xPAP Machine
-– an easy experiment you can do yourself on your own machine.
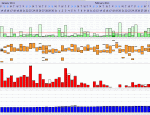
After awakening this morning, I did an experiment before turning off my S9 AutoSet (other members here might want to do the same). At exactly 8:53am I took a very deep breath and held it for a full minute. I then exhaled with mouth closed, and resumed normal breathing through my nasal pillows mask, a Swift FX. (Any mask will do.) Presented below are the resulting graphs zoomed in on the time span 8:53 to 8:58, followed by the full night’s graph for perspective.
It appears from the Flow Rate, Tidal Volume and Inspiration Time graphs that the S9 detected my held breath and, waiting until I resumed breathing (in accordance with the machine's algorithm), it recorded it as an obstructive apnea at 8:54. Both a (presumed) oxygen saturating effect of the initial big inhale I took at 8:53 and the full desaturating effect from not breathing until 8:54, appear to be properly reflected in the SpO2 graph: initially rising by 4% from 94 to quickly peak at 98% and then falling 5% during the next 60 seconds to a low of 93%. It correctly recorded my breath-holding episode as an obstructive apnea event at 8:54 when I resumed breathing. I caused the ‘obstruction’ by purposely physically immobilizing my rib cage and preventing any breaths to be taken for one full minute. (You don’t have to hold your breath for that long.)
Upon resuming normal breathing, the O2 saturation level moved quickly back up to peak at 98% and, minutes later, returned to the steadier base level of about 96%. Amazing how quickly and efficiently the human body can work. I had no idea that oxygen saturation levels change so rapidly, both to the downside and upside. Could that really be? Or am I misinterpreting the graphs and forming an erroneous conclusion? I have read before an opinion here that saturation and desaturation are more gradual and do not happen so quickly. Maybe our more experienced members can comment on that for us.
I encourage readers to duplicate the experiment and let us know here whether or not you were able to duplicate my test results. It’s easy to do. (Take a very deep breath if you want to hold it for 30 seconds or more, or just hold it for as long as is comfortable , but make a note of exactly how long it was and the precise start and stop times so you can identify and look over that time span later on the graphs.)
Let's do a PEER REVIEW of my findings. Do the experiment yourself. It's quick and easy. See if you can duplicate my results. Let’s see if my observations are correct by how many members, if any, get similar graphical test results (and how many get different results). And, if confirmed correct by your test results, let’s see which machines and models are sufficiently sensitive and responsive to produce these graphed results.
I also find quite interesting, and surprising, that my O2 desats held at 93% and above during this breath-holding experiment and in the period that followed afterward. QUESTION: What do all the earlier graphed lower desat readings mean? Are they right? Are the pulse-oximeters accurate? If they are and if those low desats are correct, why did they go so low? Or are they wrong and are pulse oximeters inherently inaccurate and unreliable? (I doubt that.) None of the recorded central or obstructive apnea lasted anywhere close to a full minute. All were in the 10 to 23 seconds range. And yet they resulted in desat readings down in the 80's. What's going on? Avi, rubysue, John, Pugsy, anybody?


