Adjusting SleepyHead Graph Display

General Discussion on any topic relating to CPAP and/or Sleep Apnea.
User avatar
NateS
Posts: 1716
Joined: Wed Dec 14, 2011 8:53 pm
Location: Kaatskill Mts-Washington Irving

Adjusting SleepyHead Graph Display

Post by NateS » Sat Feb 25, 2012 10:49 am

Pugsy wrote:
DrPepper00 wrote:I only have two naps and two nights of data. First nap and night are ok. The second nap had the cut off graph and the second night continued it. I will post on the other thread since it doesn't seem to be something I did accidently.
I figured out how to manually change the pressure graph instead of the 0.0 settings which do the automatic scale thing. See image below. I went to preferences/graphs tab and put mouse cursor directly on the 0.0 under max column and doubled clicked mouse...0.0 opened up so I could change the max to 20.0. Click "Ok" and the change was made to my graphs and top scale went to 20 from the 15 that I did have.
Image
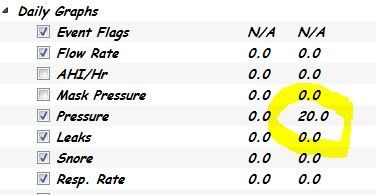
I am trying to adjust to consulting SleepyHead/Mac exclusively but for one thing my brain misses the prominent red line in the Leak Graph in ResScan/Windows, so I tried to compensate for it by following the above instructions to put a "floor" in the SleepyHead Leak graph by changing the Min in that graph from 0.0 to 24 but it didn't seem to change the appearance of the Leak graph in any way.

Am I understanding that the above-quoted instructions are intended as a way to change the visual appearance of the graphs in SleepyHead?

If so, am I doing it wrong?

What should I do differently to make it happen?

Thanks, Nate

PS - Just to see if it was a problem only with the Mac version of SH, I tried it in SleepyHead/Windows too and it didn't work there either.

_________________
Mask: DreamWear Nasal CPAP Mask with Headgear
Additional Comments: ResMed AirCurve 10 ASV; Dreamwear Nasal Mask Original; CPAPMax Pillow; ResScan & SleepyHead
Last edited by NateS on Sat Feb 25, 2012 11:01 am, edited 1 time in total.
Central sleep apnea AHI 62.6 pre-VPAP. Now 0 to 1.3
Present Rx: EPAP: 8; IPAPlo:11; IPAPHi: 23; PSMin: 3; PSMax: 15
"I've had a perfectly wonderful evening, but this wasn't it." —Groucho Marx

User avatar
Pugsy
Posts: 65117
Joined: Thu May 14, 2009 9:31 am
Location: Missouri, USA

Re: Adjusting SleepyHead Graph Display

Post by Pugsy » Sat Feb 25, 2012 11:00 am

The above instructions were offered to help someone who happened to be seeing the graph max out for some reason instead of auto adjust like it does for everyone else. So for a rare occurrence.

I think I understand what you are wanting to see or do but I don't have time at the moment to play around with things to see if I can do what you want.

Would you send me a private message just to remind me what you are wanting to see and tonight when I get home from the hospital I will see if I can fiddle with things to get you something workable. I don't know that what you want can be done but I can try.

So you are only wanting to see leaks above 24 L/min? Is that right?
So you can easily ignore the stuff below 24 L/min?

I am using a ResMed machine now so I will have similar leak lines and I can see if some setting combination will do what you want.

Send me the private message because I will see it and it will jog my memory about my promise to see what I can do. Otherwise, I might forget.

_________________
Machine: AirCurve™ 10 VAuto BiLevel Machine with HumidAir™ Heated Humidifier
Additional Comments: Mask Bleep Eclipse https://bleepsleep.com/the-eclipse/
I may have to RISE but I refuse to SHINE.

User avatar
NateS
Posts: 1716
Joined: Wed Dec 14, 2011 8:53 pm
Location: Kaatskill Mts-Washington Irving

Re: Adjusting SleepyHead Graph Display

Post by NateS » Sat Feb 25, 2012 1:35 pm

Pugsy wrote:The above instructions were offered to help someone who happened to be seeing the graph max out for some reason instead of auto adjust like it does for everyone else. So for a rare occurrence.

I think I understand what you are wanting to see or do but I don't have time at the moment to play around with things to see if I can do what you want.

Would you send me a private message just to remind me what you are wanting to see and tonight when I get home from the hospital I will see if I can fiddle with things to get you something workable. I don't know that what you want can be done but I can try.

So you are only wanting to see leaks above 24 L/min? Is that right?
So you can easily ignore the stuff below 24 L/min?

I am using a ResMed machine now so I will have similar leak lines and I can see if some setting combination will do what you want.

Send me the private message because I will see it and it will jog my memory about my promise to see what I can do. Otherwise, I might forget.
Pugsy, Thanks very much for your reply.

No actually my first choice was to get a red line like in ResScan so I can see leaks both above and below the 24 L/min, but since I can't find any option to plant a red line in SleepyHead I thought maybe at least it would help if I could settle for only displaying the leaks above 24L/min.

The way it is, when I look at the Leak chart in ResScan I feel that I instantly understand how my night went as to how my mask and chinstrap worked (as I try tinkering with different adjustments and combinations trying to find the perfect setup for my mask and chinstrap), but when I look at the Leak graph in SleepyHead I have to study and study it before I get any meaning and conclusions out of it. That's just the way my brain works I guess.

There are other reasons why I would prefer to use SleepyHead but right now I find myself jumping back and forth because of this seeming deficiency in the Leak graph. Jumping back and forth is a big nuisance, especially since I am on a Mac and have to fire up a virtual machine in Parallels to see and use my ResScan program which runs slower than it would natively.

Thanks in advance for any help and advice!

Regards, Nate

_________________
Mask: DreamWear Nasal CPAP Mask with Headgear
Additional Comments: ResMed AirCurve 10 ASV; Dreamwear Nasal Mask Original; CPAPMax Pillow; ResScan & SleepyHead
Central sleep apnea AHI 62.6 pre-VPAP. Now 0 to 1.3
Present Rx: EPAP: 8; IPAPlo:11; IPAPHi: 23; PSMin: 3; PSMax: 15
"I've had a perfectly wonderful evening, but this wasn't it." —Groucho Marx

User avatar
b360155
Posts: 163
Joined: Sat Oct 22, 2011 7:46 pm
Location: North Richland Hills, TX

Re: Adjusting SleepyHead Graph Display

Post by b360155 » Sat Feb 25, 2012 4:56 pm

Nate:
The way I understand the graphing preference adjustments in Sleepyhead, you can only set a minimum and maximum value that is equal to or outside the range of values in your graph. So, for instance if you have leaks ranging from a minimum of 0 to a maximum of 30, setting the values in preferences at 0 for minimum and 70 for maximum will show you a graph with values from 0 to 70 on your X axis (the vertical scale on the left). However, if you try to set a minimum at 10 and a maximum at 20, the graph is still going to give you a scale from 0 to 30 on the X axis because you have data outside of the 10 to 20 range.
You're right, there is no way to superimpose a red line on your leak graph currently in Sleepyhead. And, there is no way you can set a "floor" at 24, because you'll undoubtedly have data below 24, so even if you put 24 as the minimum setting, you'll still see data below 24, because it exists and the graph isn't going to ignore data that is there.
I have my graph preferences set at 0 and 24 for both my overview and daily graphs. Since early on in my therapy back in September/October, I had some almost 70 l/min leaks, my overview graphs are still going to show a range from 0 to 70. However, on my daily graphs, as long as I have a complete evening under 24, the entire graph will be displayed and the range on the X axis will be from 0 to 24. If you have a night where you get a 30 l/min spike, then you're X axis values are going to show something like 0 to some value slightly above whatever your maximum leak rate for that evening was.
If your goal is to be below 5.0 l/min leak rate for an entire evening, you could set your daily values at 0 to 5 in your preferences. Then when you view your data, if you see the X axis ranges from 0 to 5 in your daily graph, you know you've met your goal. However, if you see a daily graph that ranges from 0 to 10 for example, then you know that you haven't met that goal for that particular day because your graph is going to show data ranging between 0 and 10 instead of only 0 to 5.
Make sense?

_________________
Mask: Quattro™ FX Full Face CPAP Mask with Headgear
Humidifier: S9™ Series H5i™ Heated Humidifier with Climate Control
Additional Comments: Using ResScan Version 3.16 Software and Sleepyhead 0.9.2

User avatar
NateS
Posts: 1716
Joined: Wed Dec 14, 2011 8:53 pm
Location: Kaatskill Mts-Washington Irving

Re: Adjusting SleepyHead Graph Display

Post by NateS » Sat Feb 25, 2012 5:59 pm

Thanks, b360155.

Yes, I think I understand what you mean, although I am disappointed.

Looks like I am never going to be able to use SleepyHead, at least the way I use ResScan, for spotting Leak trends and comparing them with mask and chinstrap fittings.

Best regards, Nate

_________________
Mask: DreamWear Nasal CPAP Mask with Headgear
Additional Comments: ResMed AirCurve 10 ASV; Dreamwear Nasal Mask Original; CPAPMax Pillow; ResScan & SleepyHead
Central sleep apnea AHI 62.6 pre-VPAP. Now 0 to 1.3
Present Rx: EPAP: 8; IPAPlo:11; IPAPHi: 23; PSMin: 3; PSMax: 15
"I've had a perfectly wonderful evening, but this wasn't it." —Groucho Marx

rich0
Posts: 60
Joined: Sun Feb 12, 2012 6:36 am

Re: Adjusting SleepyHead Graph Display

Post by rich0 » Mon Feb 27, 2012 6:28 am

NateS wrote:Looks like I am never going to be able to use SleepyHead, at least the way I use ResScan, for spotting Leak trends and comparing them with mask and chinstrap fittings.
Never say never. I can't imagine that adding a fixed configurable red line to the plot would be difficult. Depending on how the widgets work the scaling might be easy to manage as well. SleepyHead is constantly evolving, and you can always log a feature request at: https://sourceforge.net/tracker/?group_ ... id=2089184 . Better still, you can always contribute a patch if you know how to program.

I believe Jedimark is taking a break right now, so I wouldn't expect new releases for a little while.
Machine: PRS1 AutoSV (950P)

User avatar
NateS
Posts: 1716
Joined: Wed Dec 14, 2011 8:53 pm
Location: Kaatskill Mts-Washington Irving

Re: Adjusting SleepyHead Graph Display

Post by NateS » Mon Feb 27, 2012 12:42 pm

You're right.

Thanks, rich0

Regards, Nate

_________________
Mask: DreamWear Nasal CPAP Mask with Headgear
Additional Comments: ResMed AirCurve 10 ASV; Dreamwear Nasal Mask Original; CPAPMax Pillow; ResScan & SleepyHead
Central sleep apnea AHI 62.6 pre-VPAP. Now 0 to 1.3
Present Rx: EPAP: 8; IPAPlo:11; IPAPHi: 23; PSMin: 3; PSMax: 15
"I've had a perfectly wonderful evening, but this wasn't it." —Groucho Marx

User avatar
Lizistired
Posts: 2835
Joined: Tue Dec 14, 2010 10:47 pm
Location: Indiana

Re: Adjusting SleepyHead Graph Display

Post by Lizistired » Wed Jul 04, 2012 10:03 pm

Thanks for this thread. Exactly what I was looking for.

_________________
Humidifier: S9™ Series H5i™ Heated Humidifier with Climate Control
Additional Comments: Swift FX sometimes, CMS-50F, Cervical collar sometimes, White noise, Zeo... I'm not well, but I'm better.