


http://s1242.photobucket.com/albums/gg5 ... age172.jpg
I finally found out how to post this chart, I need help reading it, and advice on how to reduce AHI. Doctor at hospital seems to think it is ok to have around AHI of 10...he says it is a big improvement on 60!
Anyone know what these charts mean?


4 posts
• Page 1 of 1
Anyone know what these charts mean?
flocof
Resmed S9 VPAP Adapt
Resmed S9 VPAP Adapt

Re: Anyone know what these charts mean?
Yes, you're probably a lot better off with 10 than 60. 5 or lower would be even better.flocof wrote:http://s1242.photobucket.com/albums/gg5 ... age172.jpg
I finally found out how to post this chart, I need help reading it, and advice on how to reduce AHI. Doctor at hospital seems to think it is ok to have around AHI of 10...he says it is a big improvement on 60!
You need to scroll up higher and show the event flags and flow rate graphs.
_________________
| Mask: Swift™ FX Nasal Pillow CPAP Mask with Headgear |
| Humidifier: S9™ Series H5i™ Heated Humidifier with Climate Control |
| Additional Comments: Also SleepyHead, PRS1 Auto, Respironics Auto M series, Legacy Auto, and Legacy Plus |
Please enter your equipment in your profile so we can help you.
Click here for information on the most common alternative to CPAP.
If it's midnight and a DME tells you it's dark outside, go and check for yourself.
Useful Links.
Click here for information on the most common alternative to CPAP.
If it's midnight and a DME tells you it's dark outside, go and check for yourself.
Useful Links.
Re: Anyone know what these charts mean?
Yes. there are two photos, the second one has the top of the charts. Thanks for any advice. As I am bringing up my twin grandchildren on my own and have been doing so for the last 7 years....I need all the energy I can get!
flocof
Resmed S9 VPAP Adapt
Resmed S9 VPAP Adapt

Re: Anyone know what these charts mean?
For those interested in the image of the graphs:
Four things jump out at me:
1) A significant number of the apneas are being flagged as CAs. Additional pressure probably won't address these. Did your sleep study mention anything about central apnea or complex apnea?
2) Any chance you were awake or partially awake during the time between midnight and 1:30? What about after 6:00?
3) All of your leaks are below the 24 L/min mark that Resmed uses to flag "Large Leaks"---those that are large enough to cause problems for the machine's ability to provide effective therapy and accurate data. But the unintentional leak rate curve is still pretty spiky---particularly between midnight and 1:30. Any chance you were mouth breathing during that time?
4) The S9 thinks there's some soft snoring going on all night long. It's not very loud, but it's there for the entire night.
As for a brief introduction to what each of the graphs is trying to convey:
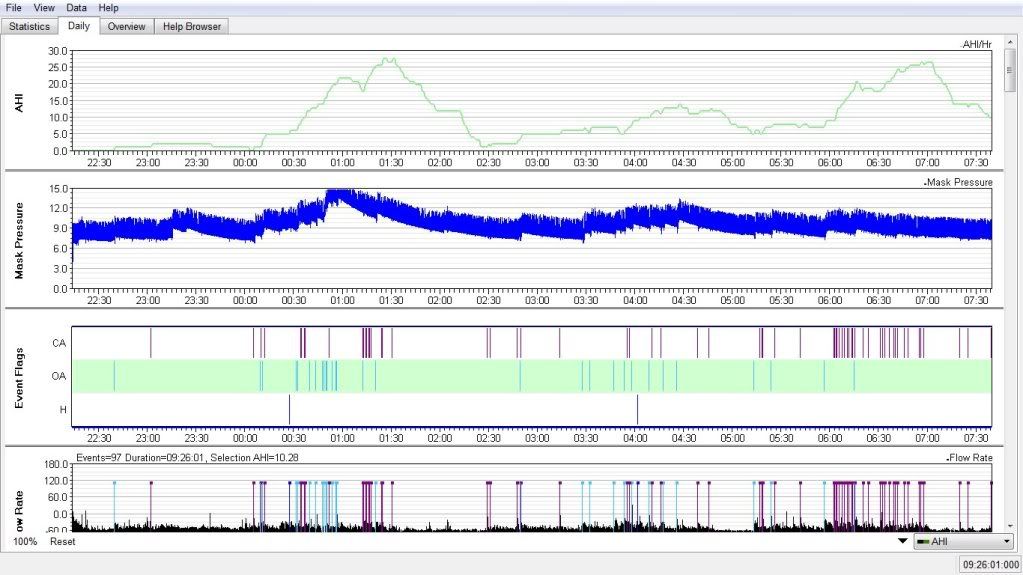
AHI graph This gives the AHI per hour as calculated on the last hour of sleep at any particular time. In other words, at every time value, it tells you how many events occurred during the previous hour. The huge mountain between 0:30 and 2:30 that tops out at over 30 tells me that there are over thirty events during that first nasty cluster that lasts roughly from midnight to 1:30. I'd say that's way to high if you see this kind of peak in the AHI graph night after night. If this is an isolated bad night, however, that's something else.
Mask pressure This curve tells you how much pressure is being delivered at the mask. If you zoom in you will see the mask pressure changes on every breath due to EPR. Looks to me like you've got EPR set to 3.
Event Flags This table gives you a visual table of when each event occurred and what kind of event it was.
Flow Rate This curve shows each and every breath you took during the night. When you are not zoomed in, there's not much detail except for the event flags that are superimposed. But if you click on this curve you can zoom in to see the individual breaths. The part of the curve above the 0 line are your inhalations. The part below the 0 curve are the exhalations. When the curve is flat (or almost flat) for 10 seconds or more, that represents when you are not breathing long enough for the machine to flag an apnea or hypopnea of some sort.
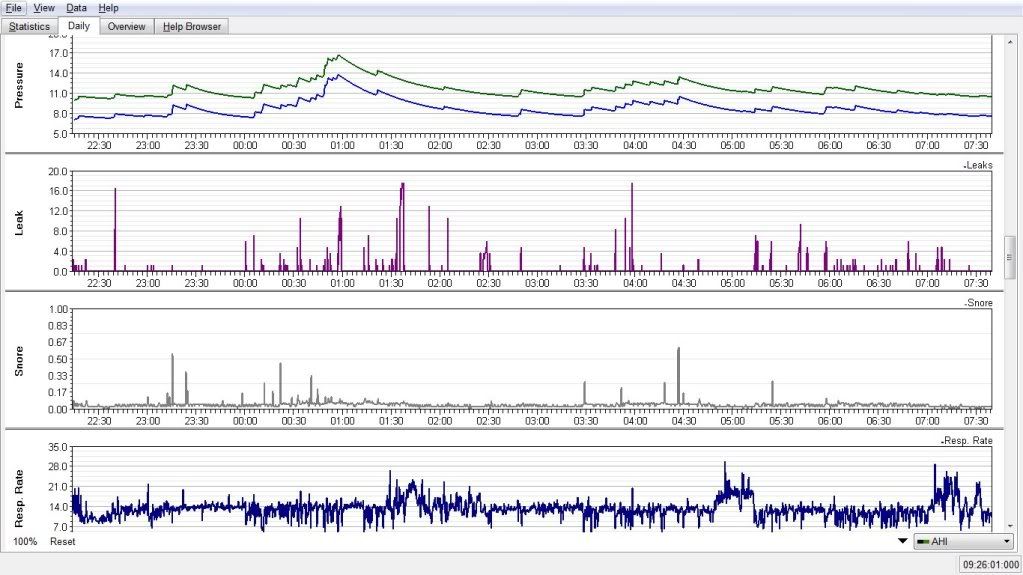
Pressure This curve shows the pressure settings at each moment of the night. The top curve is the actual pressure setting; the bottom one is the pressure setting - EPR since the AutoSet acts similarly to (but not identically to) a bi-level machine. You can see how the pressure was increased in response to the OAs in the first cluster of events, but how the machine did NOT increase pressure once it started detecting nothing but CAs. That is how the machine is supposed to react since increasing pressure does NOT help prevent CAs.
Leak This curve shows your unintentional leak rate as calculated by the S9 itself. The Resmed machines estimate the intentional leak rate for the mask (via the mask setting) and subtract it off the leak data before reporting the leak rate. So any leaks reported here are unintentional leaks. Ideally you want your leak curve to stay down at 0 all night long. But most of us are not going to have a perfectly flat 0 L/min unintentional leak rate. But we do aim for reasonably flat leak lines very close to that 0 L/min line. Resmed literature indicates that Resmed engineers are happy if the leaks stay below 24 L/min. Yours are below that. Experience from actual CPAPers says that leaks can cause serious comfort issues well before that 24 L/min level. You leak line is spiky enough for us to ask whether leaks are causing some issues for you even though they are not yet large enough to be labeled problems by the Resmed engineers who designed your equipment.
Snore A visual representation of the snoring being picked up by the machine. The machine measures snoring based on subtle changes in the Flow Rate curve. It's not a perfect algorithm. But in general the larger the numbers, the more significant the S9 believes the snoring to be. S9 AutoSets will increase the pressure if they start detecting snoring---or at least snoring above some kind of a threshold. I believe that snoring for the S9 is recorded on a 0 to 1 scale where 0 = No Snoring and 1 = Snoring like a Freight Train. (I'm not quite sure I'm remembering this completely correct though.)
Resp. Rate This is just the number of breaths per minute. In normal sleep breathing, the resp. rate usually stays in a pretty small range. In some people there is real difference between the baseline resp. rate in REM vs. the resp. rate in NREM. In other people, there is not that big of a difference.
Hope that helps.
Four things jump out at me:
1) A significant number of the apneas are being flagged as CAs. Additional pressure probably won't address these. Did your sleep study mention anything about central apnea or complex apnea?
2) Any chance you were awake or partially awake during the time between midnight and 1:30? What about after 6:00?
3) All of your leaks are below the 24 L/min mark that Resmed uses to flag "Large Leaks"---those that are large enough to cause problems for the machine's ability to provide effective therapy and accurate data. But the unintentional leak rate curve is still pretty spiky---particularly between midnight and 1:30. Any chance you were mouth breathing during that time?
4) The S9 thinks there's some soft snoring going on all night long. It's not very loud, but it's there for the entire night.
As for a brief introduction to what each of the graphs is trying to convey:
AHI graph This gives the AHI per hour as calculated on the last hour of sleep at any particular time. In other words, at every time value, it tells you how many events occurred during the previous hour. The huge mountain between 0:30 and 2:30 that tops out at over 30 tells me that there are over thirty events during that first nasty cluster that lasts roughly from midnight to 1:30. I'd say that's way to high if you see this kind of peak in the AHI graph night after night. If this is an isolated bad night, however, that's something else.
Mask pressure This curve tells you how much pressure is being delivered at the mask. If you zoom in you will see the mask pressure changes on every breath due to EPR. Looks to me like you've got EPR set to 3.
Event Flags This table gives you a visual table of when each event occurred and what kind of event it was.
Flow Rate This curve shows each and every breath you took during the night. When you are not zoomed in, there's not much detail except for the event flags that are superimposed. But if you click on this curve you can zoom in to see the individual breaths. The part of the curve above the 0 line are your inhalations. The part below the 0 curve are the exhalations. When the curve is flat (or almost flat) for 10 seconds or more, that represents when you are not breathing long enough for the machine to flag an apnea or hypopnea of some sort.
Pressure This curve shows the pressure settings at each moment of the night. The top curve is the actual pressure setting; the bottom one is the pressure setting - EPR since the AutoSet acts similarly to (but not identically to) a bi-level machine. You can see how the pressure was increased in response to the OAs in the first cluster of events, but how the machine did NOT increase pressure once it started detecting nothing but CAs. That is how the machine is supposed to react since increasing pressure does NOT help prevent CAs.
Leak This curve shows your unintentional leak rate as calculated by the S9 itself. The Resmed machines estimate the intentional leak rate for the mask (via the mask setting) and subtract it off the leak data before reporting the leak rate. So any leaks reported here are unintentional leaks. Ideally you want your leak curve to stay down at 0 all night long. But most of us are not going to have a perfectly flat 0 L/min unintentional leak rate. But we do aim for reasonably flat leak lines very close to that 0 L/min line. Resmed literature indicates that Resmed engineers are happy if the leaks stay below 24 L/min. Yours are below that. Experience from actual CPAPers says that leaks can cause serious comfort issues well before that 24 L/min level. You leak line is spiky enough for us to ask whether leaks are causing some issues for you even though they are not yet large enough to be labeled problems by the Resmed engineers who designed your equipment.
Snore A visual representation of the snoring being picked up by the machine. The machine measures snoring based on subtle changes in the Flow Rate curve. It's not a perfect algorithm. But in general the larger the numbers, the more significant the S9 believes the snoring to be. S9 AutoSets will increase the pressure if they start detecting snoring---or at least snoring above some kind of a threshold. I believe that snoring for the S9 is recorded on a 0 to 1 scale where 0 = No Snoring and 1 = Snoring like a Freight Train. (I'm not quite sure I'm remembering this completely correct though.)
Resp. Rate This is just the number of breaths per minute. In normal sleep breathing, the resp. rate usually stays in a pretty small range. In some people there is real difference between the baseline resp. rate in REM vs. the resp. rate in NREM. In other people, there is not that big of a difference.
Hope that helps.
_________________
| Machine: DreamStation BiPAP® Auto Machine |
| Mask: Swift™ FX Nasal Pillow CPAP Mask with Headgear |
| Additional Comments: PR System DreamStation and Humidifier. Max IPAP = 9, Min EPAP=4, Rise time setting = 3, minPS = 3, maxPS=5 |
4 posts
• Page 1 of 1