allend wrote:
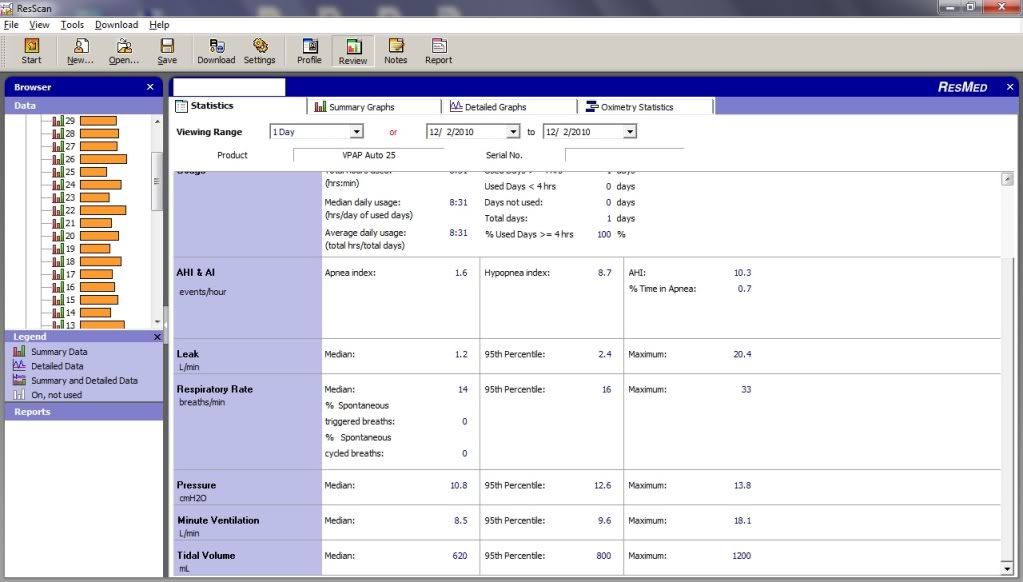
Note the AI of 1.6 and the HI of 8.7 but the graphs show large AIs and tinh HIs.
I think you're misinterpreting the meaning of
AHI,
AI, and
HI and the numbers ResScan shows on the flags for each of the apneas it detects.
Your AHI = 1.6 means that on this night you were having an
average of about 1.6 apneas EACH hour. Since your machine was on for about 8.5 hours, that means that you experienced about
(1.6 apneas per hour) * (8.5 hours) = 13.6 = 14 apneas during the whole night. (Resmed truncates decimals, so you always round up)
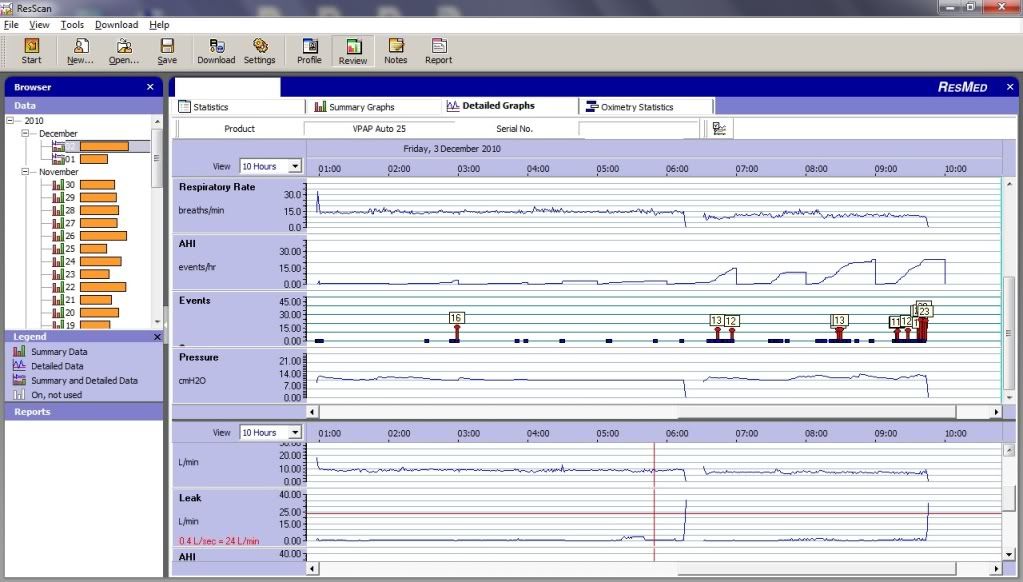
And when I look at the detailed data graph, I can see
at least 12 red flags with numbers on the top of them. The other two are probably well hidden in the cluster of events you had between 9:00 and 10:00 AM. Each of these red flags represents a SINGLE apnea that the Resmed VPAP Auto 25 detected. The number on top of the flag indicates
how long the apnea lasted. In other words, the number on the flag indicates how many seconds the VPAP Auto 25 thinks you were NOT breathing due to an obstructive apnea.
Your HI = 8.7 means that on this night you were having an
average of 8.7 hypopneas EACH hour. Since your machine ran for about 8.5 hours, that means that you experienced about
(8.7 hyponpneas per hour)*(8.5 hours) = 73.94 = 74 hypopneas during the whole night.
Now each hypopnea gets a little blue square on the event graph. The VPAP Auto 25 does NOT try to determine how long the hypopnea lasted, it merely indicates that one occurred. The box is put at the END of the hypopnea, if I recall correctly. Now when I try to count the boxes, I really don't see anywhere near 70+ of them. But the thing about these hypopnea boxes is that they easily run together and that they can hide each other. To really count the hypopnea boxes, you need to change the TIME FRAME on the bottom set of graphs to something really small (five minutes at most) and scroll through the data for the entire night focusing the event graph. Each time you come to boxes that are running into each other, you need to reduce the time frame even further---you can go all the way down to 10 second intervals if you want to.
So my interpretation of your data is that SINCE the AHI number makes since (14 apneas in 8.5 hours is 14/8.5 = 1.6 apneas per hour, so AHI=1.6), there's no reason to suspect that the HI number is wrong---in the sense that your VPAP Auto 25 likely counted what it thinks were 74 hypopneas during the 8.5 hours the machine was running.
Also, to me it looks like the leaks are terrificly controlled so why the AIs when I sleep on my side?
Alan
Your leaks are "ok" but not perfect. As to why you're having so many apneas on your side, I don't know. It may be an odd occurance of this particular night or it may be that you need more pressure support on your side or it maybe something else. If you continue to regularly have clusters like you had between 9:00 and 10:00 am on this day, then you should tell the sleep doctor's office that you're worried about whether your current prescribed pressure level(s) are effectively managing your apnea.
How long have you been using your machine? If you're a real newbie, some of these issues may begin to resolve as you get more used to the machine. But if they don't, you really should let your sleep doctor know that your AHI is still well above 5.0 even though your AI is relatively low.


