How is the "Daily Events Per Hour Chart" useful?

General Discussion on any topic relating to CPAP and/or Sleep Apnea.
User avatar
JoyD.
Posts: 528
Joined: Sat Feb 14, 2009 7:21 pm
Location: Central Indiana, USA

How is the "Daily Events Per Hour Chart" useful?

Post by JoyD. » Thu Apr 16, 2009 2:21 pm

I'm going to try this and see if it works

I'd like someone who is good at reading the Daily Events Per Hour Chart from Encore Viewer . . . to tell me what is most useful about this particular chart . . . if it is useful at all.

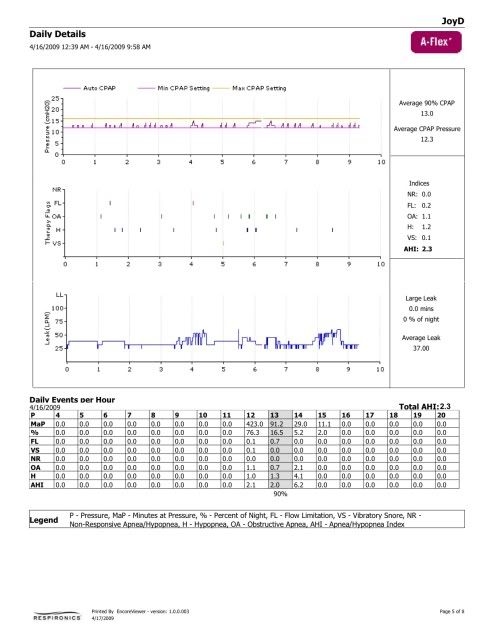
In the report below, I see that 90% of the night my pressure was at 13. (I always look at the column on the right just below the 90% pressure, but I read others say how useful this CHART is to them.) OKAY, If 90% of the night my pressure was 13, what does the "%" (% of the night) in the horizontal row of the chart tell me . . . SPECIFICALLY the numbers in each of the pressure columns? How does this make sense in light that 90% of the night my pressure was 13?

Thanks,
Joy

PS - If I did this right, my APAP report should show up large enough to read. . . if not, HELP . . . I need to learn to post these things
Image

_________________
Machine: Airsense 10 Card to Cloud
Mask: Zest Nasal CPAP Mask with Headgear
Additional Comments: CPAP Pr 14.0; EPR:3 Full; Heated Hose; 1" NexCare Low Trauma Tape; PurSleep Buckwheat Hull Pillow; Caldera Releaf Collar.
Last edited by JoyD. on Fri Apr 17, 2009 7:07 am, edited 1 time in total.
Other Accessories & Software: Wellue O2 Ring; OSCAR; SleepHQ Pro.

User avatar
LinkC
Posts: 3154
Joined: Wed Oct 29, 2008 1:06 pm
Location: Amelia Island, FL

Re: How is the "Daily Events Per Hour Chart" useful?

Post by LinkC » Thu Apr 16, 2009 3:10 pm

JoyD. wrote:In the report below, I see that 90% of the night my pressure was at 13.
My understanding is the "90% pressure" (13cm, in your case) is the pressure which eliminates 90% of your A/H events. That's indicated by the 90% at the bottom of the chart.

The second row (%) indicates how much of the therapy session was spent at each pressure. In your case, you were at 13cm for 16.5% of the night. All the numbers in the second row will add up to 100%.

But I'm certainly no "expert" at reading the charts...

_________________
MachineMaskHumidifier
Additional Comments: 11-14 cmH2O
The OSA patient died quietly in his sleep.
Unlike his passengers who died screaming as the car went over the cliff...

User avatar
travismcgee
Posts: 93
Joined: Mon Jan 07, 2008 7:28 am
Location: minnesota

Re: How is the "Daily Events Per Hour Chart" useful?

Post by travismcgee » Thu Apr 16, 2009 3:43 pm

You have to remember that it is an average over the entire night. If you add up the percentages for 12 cms and 13 cms it is really 92.8%. It is basically telling you that for aproximately 90% of the time your machine was running it was blowing at 12 or 13 cms. I believe the way the data is recorded it will add up the percent time spent at each pressure and when those numbers hit 90% that will be your average 90% CPAP number.
"The major difference between a thing that might go wrong and a thing that cannot possibly go wrong is that when a thing that cannot possibly go wrong goes wrong it usually turns out to be impossible to get at or repair."

Douglas Adams

User avatar
roster
Posts: 8159
Joined: Wed Jan 18, 2006 8:02 pm
Location: Chapel Hill, NC

Re: How is the "Daily Events Per Hour Chart" useful?

Post by roster » Thu Apr 16, 2009 3:46 pm

Forget that 90% pressure statistic. It is talked about often here but it is really worthless if you understand statistics and what you are trying to accomplish with your therapy. I never look at it.

The way I would look at this chart if it were mine is:
-FL only two and that is excellent
-OA about 8 and that is very good
-H only about 9 and that is good
-Leak is flat for the first part of the night and then you probably start a little tossing and turning and the leak goes up. But it is OK in my experience if it stays under 75. The machine will still be able to maintain the prescribed pressure.
-Looks like you got up to pee only one time - good.

I consider that a good night overall! Do you feel like you slept well?

Now this is just me, but I like to keep the apneas under 7 per night and I would like to blow a few of those hypopneas away. I would bump the minimum pressure up by 0.5 cm and see what happens. You can always go back after one night of trying this.

Good luck,
Rooster
I have a vision that we will figure out an easy way to ensure that children develop wide, deep, healthy and attractive jaws and then obstructive sleep apnea becomes an obscure bit of history.https://www.youtube.com/watch?v=0ycw4uaX ... re=related

User avatar
JoyD.
Posts: 528
Joined: Sat Feb 14, 2009 7:21 pm
Location: Central Indiana, USA

Re: How is the "Daily Events Per Hour Chart" useful?

Post by JoyD. » Thu Apr 16, 2009 3:55 pm

LinkC wrote:
My understanding is the "90% pressure" (13cm, in your case) is the pressure which eliminates 90% of your A/H events. That's indicated by the 90% at the bottom of the chart.

The second row (%) indicates how much of the therapy session was spent at each pressure. In your case, you were at 13cm for 16.5% of the night. All the numbers in the second row will add up to 100%.
Ah . . . . . . pressure eliminating 90% of events! Now I can distinguish between the 90% pressure, and the % row (the 13cm column in particular). Thanks LinkC!

I'd STILL like to hear why many find this chart so valuable. As I said, I have only been looking at the numbers on the far right (not the Chart). Am I missing something important?

_________________
Machine: Airsense 10 Card to Cloud
Mask: Zest Nasal CPAP Mask with Headgear
Additional Comments: CPAP Pr 14.0; EPR:3 Full; Heated Hose; 1" NexCare Low Trauma Tape; PurSleep Buckwheat Hull Pillow; Caldera Releaf Collar.
Other Accessories & Software: Wellue O2 Ring; OSCAR; SleepHQ Pro.

User avatar
JoyD.
Posts: 528
Joined: Sat Feb 14, 2009 7:21 pm
Location: Central Indiana, USA

Re: How is the "Daily Events Per Hour Chart" useful?

Post by JoyD. » Thu Apr 16, 2009 4:00 pm

,
Thanks Rooster for your helpful assessment. I'll do as you suggested and see what happens!

And, yes, I felt like I slept well. I usually have felt well since going on CPAP . . . my challenge has been just finding the mask that didn't keep me up half the night leaking. I'm finally conquering that. And believe that I have three of the best nasal masks going from what I read.

Joy

_________________
Machine: Airsense 10 Card to Cloud
Mask: Zest Nasal CPAP Mask with Headgear
Additional Comments: CPAP Pr 14.0; EPR:3 Full; Heated Hose; 1" NexCare Low Trauma Tape; PurSleep Buckwheat Hull Pillow; Caldera Releaf Collar.
Other Accessories & Software: Wellue O2 Ring; OSCAR; SleepHQ Pro.

User avatar
Wulfman
Posts: 12317
Joined: Thu Jul 07, 2005 3:43 pm
Location: Nearest fishing spot

Re: How is the "Daily Events Per Hour Chart" useful?

Post by Wulfman » Thu Apr 16, 2009 4:05 pm

No........ (reply to LinkC's post)
The "90% pressure" is the pressure which you spent 90% of the night AT or BELOW.

In Auto mode, it's usually a "moving target". And, along the lines of what rooster said......I don't pay much attention to it.

Den
(5) REMstar Autos w/C-Flex & (6) REMstar Pro 2 CPAPs w/C-Flex - Pressure Setting = 14 cm.
"Passover" Humidification - ResMed Ultra Mirage FF - Encore Pro w/Card Reader & MyEncore software - Chiroflow pillow
User since 05/14/05

-SWS
Posts: 5301
Joined: Tue Jan 11, 2005 7:06 pm

Re: How is the "Daily Events Per Hour Chart" useful?

Post by -SWS » Thu Apr 16, 2009 4:22 pm

JoyD wrote:I'd STILL like to hear why many find this chart so valuable.
Joy, that chart becomes increasingly valuable as more and more things go wrong with treatment. Your treatment actually looks pretty good---and that's going to make for one comparatively boring chart.

Still, there are possible tweaks, and the ubiquitous "fix those leaks" comment is just around the corner.
Wulfman wrote:In Auto mode, it's usually a "moving target".
And I would add that if that 90% target is wildly moving, then APAP modality is probably the wrong modality. Ideally it moves within a constrained range of night-to-night physiologically impacting factors other than respiratory dyscontrol (in neurology that is). Stuffy nose, GERD, sleep position, etc can all acceptably move that 90% target according to APAP design intent.

User avatar
Hawthorne
Posts: 3972
Joined: Tue Oct 19, 2004 4:46 am
Location: London Ontario -Canada

Re: How is the "Daily Events Per Hour Chart" useful?

Post by Hawthorne » Thu Apr 16, 2009 6:36 pm

Yes, the 90% pressure is the pressure you spent 90% of the night at or below.

In your chart it was 13 cm.

When I look at the "Daily events per hour" chart, I am looking to see at what my AHI was at various pressures and times during the night. In you report it was 6.2 at a pressure of 14 cm. While you didn't spend much of the night at 14 cm, a lot went on when you were at that pressure- but it was at 14 just as you were waking up to get up to the bathroom I expect. To me, that would mean I was waking up, leaning over to turn off my machine and maybe (in my case- unconsciously holding my breathe). I can see, on your "pressure" line, that you were waking and thinking about getting up, probably sitting up a bit and bending to turn off your machine maybe and, like me, maybe holding your breathe a bit without knowing it. The machine may interpret that as events. It was, however, mostly Hypopneas (4.1) and only 2.1 Apneas.

Given that, I would not be concerned about that all. It just doesn't count. You were not asleep.

If it happen at a different time - when I was definitely asleep, I would watch it for several days and consider tweaking things a litle on my machine.

I've only been monitoring my data for a little over a year but that's how I use that chart.

Others, more experienced, may say differently.

_________________
Machine: DreamStation Auto CPAP Machine
Mask: AirFit™ P10 Nasal Pillow CPAP Mask with Headgear
Humidifier: DreamStation Heated Humidifier
Additional Comments:  Backups- FX Nano masks. Backup machine- Airmini auto travel cpap

User avatar
elader
Posts: 529
Joined: Wed Oct 08, 2008 7:45 am
Location: Maryland

Re: How is the "Daily Events Per Hour Chart" useful?

Post by elader » Thu Apr 16, 2009 7:25 pm

Isnt her OA 1.1?
rooster wrote:Forget that 90% pressure statistic. It is talked about often here but it is really worthless if you understand statistics and what you are trying to accomplish with your therapy. I never look at it.

The way I would look at this chart if it were mine is:
-FL only two and that is excellent
-OA about 8 and that is very good
-H only about 9 and that is good
-Leak is flat for the first part of the night and then you probably start a little tossing and turning and the leak goes up. But it is OK in my experience if it stays under 75. The machine will still be able to maintain the prescribed pressure.
-Looks like you got up to pee only one time - good.

I consider that a good night overall! Do you feel like you slept well?

Now this is just me, but I like to keep the apneas under 7 per night and I would like to blow a few of those hypopneas away. I would bump the minimum pressure up by 0.5 cm and see what happens. You can always go back after one night of trying this.

Good luck,

_________________
MaskHumidifier

User avatar
roster
Posts: 8159
Joined: Wed Jan 18, 2006 8:02 pm
Location: Chapel Hill, NC

Re: How is the "Daily Events Per Hour Chart" useful?

Post by roster » Thu Apr 16, 2009 7:45 pm

[quote="elader"]Isnt her OA 1.1?

Her OA for the night was 8.
Her OAI was 1.1.

User avatar
JoyD.
Posts: 528
Joined: Sat Feb 14, 2009 7:21 pm
Location: Central Indiana, USA

Re: How is the "Daily Events Per Hour Chart" useful?

Post by JoyD. » Thu Apr 16, 2009 8:14 pm

Rooster wrote:
Her OA for the night was 8.
Her OAI was 1.1.
So you're multiplying the hours I slept by the OA's per hour . . .

_________________
Machine: Airsense 10 Card to Cloud
Mask: Zest Nasal CPAP Mask with Headgear
Additional Comments: CPAP Pr 14.0; EPR:3 Full; Heated Hose; 1" NexCare Low Trauma Tape; PurSleep Buckwheat Hull Pillow; Caldera Releaf Collar.
Other Accessories & Software: Wellue O2 Ring; OSCAR; SleepHQ Pro.

User avatar
JoyD.
Posts: 528
Joined: Sat Feb 14, 2009 7:21 pm
Location: Central Indiana, USA

Re: How is the "Daily Events Per Hour Chart" useful?

Post by JoyD. » Thu Apr 16, 2009 8:53 pm

Hawthorn wrote:
In you report it was 6.2 at a pressure of 14 cm. While you didn't spend much of the night at 14 cm, a lot went on when you were at that pressure- but it was at 14 just as you were waking up to get up to the bathroom I expect. To me, that would mean I was waking up, leaning over to turn off my machine and maybe (in my case- unconsciously holding my breathe). I can see, on your "pressure" line, that you were waking and thinking about getting up, probably sitting up a bit and bending to turn off your machine maybe and, like me, maybe holding your breathe a bit without knowing it. The machine may interpret that as events. It was, however, mostly Hypopneas (4.1) and only 2.1 Apneas.

Given that, I would not be concerned about that all. It just doesn't count. You were not asleep.
Wow, Hawthorn, you've got my number (pardon the pun) Here's what I was doing at that time, having pee'd & gotten the air blowing again. . . I noticed that my blinds under the curtain were letting too much light in so I was stretching as far as my hose would let me maneuvering my head (no doubt holding my breath too) so that I would not pull the hose off the machine, or worse, pull the machine off the table. This turned out to be a fiasco, and after managing to close my blinds I remember wondering what this would look like on my APAP report . . . Well . . . now I know. Can't hide much from you folks!

Joy

_________________
Machine: Airsense 10 Card to Cloud
Mask: Zest Nasal CPAP Mask with Headgear
Additional Comments: CPAP Pr 14.0; EPR:3 Full; Heated Hose; 1" NexCare Low Trauma Tape; PurSleep Buckwheat Hull Pillow; Caldera Releaf Collar.
Last edited by JoyD. on Thu Apr 16, 2009 9:09 pm, edited 1 time in total.
Other Accessories & Software: Wellue O2 Ring; OSCAR; SleepHQ Pro.

User avatar
JoyD.
Posts: 528
Joined: Sat Feb 14, 2009 7:21 pm
Location: Central Indiana, USA

Re: How is the "Daily Events Per Hour Chart" useful?

Post by JoyD. » Thu Apr 16, 2009 9:08 pm

Wulfman wrote:
In Auto mode, it's usually a "moving target".
And SWS commented:
And I would add that if that 90% target is wildly moving, then APAP modality is probably the wrong modality. Ideally it moves within a constrained range of night-to-night physiologically impacting factors other than respiratory dyscontrol (in neurology that is). Stuffy nose, GERD, sleep position, etc can all acceptably move that 90% target according to APAP design intent.
Den & SWS,

I'm in the process of sticking with one mask while I work with a narrow range on Auto to see if I can improve numbers (I use tape AND a chin strap AND Lansinoh to control leaks as best I can). If trying to find the sweet spot on Auto doesn't succeed in improving my numbers . . . my next plan is to try fixed CPAP and play with that for a while. At one point, SWS, RG made the same comment as you suggesting that I may be using the wrong modality with Auto. But she suggested that since my software won't show Flowrate & Snoring Vibrations on fixed CPAP, I might want to set my minimum & maximum pressures the same on Auto, mimicking fixed CPAP. I've found that my machine won't let me do that, though I believe I can set it one full number apart. I've been meaning to get back to her on that, but as yet have not done so.

Joy

_________________
Machine: Airsense 10 Card to Cloud
Mask: Zest Nasal CPAP Mask with Headgear
Additional Comments: CPAP Pr 14.0; EPR:3 Full; Heated Hose; 1" NexCare Low Trauma Tape; PurSleep Buckwheat Hull Pillow; Caldera Releaf Collar.
Other Accessories & Software: Wellue O2 Ring; OSCAR; SleepHQ Pro.

User avatar
JoyD.
Posts: 528
Joined: Sat Feb 14, 2009 7:21 pm
Location: Central Indiana, USA

Re: How is the "Daily Events Per Hour Chart" useful?

Post by JoyD. » Thu Apr 16, 2009 9:18 pm

,
One more thing about the Chart, if I may . . .

If 90% of the night I was at a pressure of 13 . . . how do you explain the HORIZONTAL ROW for %, that indicates I was at 13 pressure for 16.5% of the night?

_________________
Machine: Airsense 10 Card to Cloud
Mask: Zest Nasal CPAP Mask with Headgear
Additional Comments: CPAP Pr 14.0; EPR:3 Full; Heated Hose; 1" NexCare Low Trauma Tape; PurSleep Buckwheat Hull Pillow; Caldera Releaf Collar.
Last edited by JoyD. on Fri Apr 17, 2009 7:08 am, edited 1 time in total.
Other Accessories & Software: Wellue O2 Ring; OSCAR; SleepHQ Pro.