Re: S9 Flow Limitation Graph -- Questions
Posted: Tue Nov 23, 2010 8:45 pm
0.3 on what measurement scale?NotMuffy wrote:although in practice a "wide-open airway" should have a value of about 0.3
Cheers,
Bill
A Forum For All Things CPAP
https://www.cpaptalk.com/
0.3 on what measurement scale?NotMuffy wrote:although in practice a "wide-open airway" should have a value of about 0.3
I kinda suspect that 0.0 to 1.0 number might be a statistical correlation coefficient.... Resmed just might perform a covariance comparison of each inspiratory flow curve against a sinusoid (top half) as an ideal template for comparison. That's what the 420e does as well according to the patent descriptions:billbolton wrote:0.3 on what measurement scale?NotMuffy wrote:although in practice a "wide-open airway" should have a value of about 0.3
viewtopic.php?f=1&t=31210&p=269799&hili ... nt#p269799This correlation coefficient is an index ranging from 1 (sinusoidal or not flow limited) to 0 (not sinusoidal).

Fuzzy Flow LimitationNotMuffy wrote:(although what the heck does the first "F" stand for?).
viewtopic.php?f=1&t=57373&p=540485#p540295-SWS wrote: That's a halfway point on a proprietary Resmed scale. That half-scale measurement point says nothing about how "arousal susceptible" you happen to be to half-scale, quarter-scale, eighth-scale, or even sixteenth-scale Flow Limitations given Resmed's proprietary measuring scheme. So the more crucial events---resultant sleep arousals---are unfortunately not in the S9 data set.
Depending on patient-unique threshold of arousal, your sleep architecture might severely deteriorate at frequent eighth-scale FL crossings, while my architecture might stay intact despite frequent quarter-scale or half-scale FL crossings. So threshold of arousal relative to FL severity can be unique from one patient to the next. UARS patients, as an example, are thought to be hyper-arousable to flow limitations.
As a side note, I think the 420e ran a correlation coefficient comparing sinusoid against patient flow. That 0 to 1 sinusoid correlation coefficient went toward one sub-component in an overall FL probability equation. They performed a similar coefficient comparison against a square wave. That coefficient went toward a second sub-component in an overall FL probability equation. Measuring peak flow's vertical line (also shown above) left-shifted versus centered yielded a third probability sub-component... and so forth.-SWS wrote: Similarly, here are four comparison parameters Respironics strings together in algorithmically ascertaining whether flow limitation has occurred:
NotMuffy, does that guess sound plausible to you for Resmed's 0.0 to 1.0 index? Or no?
On Edit: I see that Resmed associates a 0 value with no flow limitation and a 1 value with flow limitation---perhaps a coefficient index inversion of the above toward describing likelihood of flow limitation occurrence---with or without further probability formulation(s) added.
When I say mouse over I'm referring to the graph line, not the symbols. With the window set to 8 or 10 hours what you'll see on the graph line are lines that drop straight down from the level line. That's because, in my case anyway, all of the FLs are only a few seconds long. If you expand the window to 10 minutes you'll see the graph line go up and down in steps. Put your cursor right on a level portion of the line and it'll show the value at that point. In fact, you can do that with all the graphs in Resscan to see what the numerical value is at any point on a graph line.SleepingUgly wrote:But when I run my mouse cursor over those scribbles, it could say 1.00 whether I'm above the top line at the "beehive" or 3 lines below that top line... In fact, I don't see a spot that makes my cursor say 0.
I see the exact opposite on the Flow Limitation graph. The graph line at the round symbol level has a value of 1.0. Graph lines moving toward the flat symbol end of the Y axis move toward 0. Resmed defines the round symbol to be no flow limitation.-SWS wrote:On Edit: I see that Resmed associates a 0 value with no flow limitation and a 1 value with flow limitation
Hey SleepingUgly, that link LoQ gives is your answer! If you can understand what they're saying you automatically qualify for a Master's degree in Respiratory Technology from the University of Australia! I sure don't!LoQ wrote:Fuzzy Flow LimitationNotMuffy wrote:(although what the heck does the first "F" stand for?).
Thanks for straightening that out, idamtnboy ---I typed it the exact opposite of what I meant to say. Unintentional reversals are my forte.idamtnboy wrote:I see the exact opposite on the Flow Limitation graph. The graph line at the round symbol level has a value of 1.0. Graph lines moving toward the flat symbol end of the Y axis move toward 0. Resmed defines the round symbol to be no flow limitation.-SWS wrote:On Edit: I see that Resmed associates a 0 value with no flow limitation and a 1 value with flow limitation
The complexity of this issue as expounded by those of you who are more immersed in background knowledge directly related to the instant matter of discussion is approaching perilously close to creating a multi-FRACtorial cranial condition within me.-SWS wrote:then that 0.0 to 1.0 index might be a multi-factorial index rather than uni-dimensional.
I agree. A RERA (Respiratory Effort-Related Arousal)(which is really what we're talking about here when we talk about FLs) is only a "RERA" if it has an "A".-SWS wrote:So I'm thinking FL severity is more related to how often/infrequently a patient is disturbed by their FLs rather than simply how frequent or flat the FLs happen to be...
-SWS, you know I'm a hippopotomonstrosesquipedaliophobiac!!-SWS wrote:Supercalifragilisticexpialidocious!
Son of a gun!LoQ wrote:Fuzzy Flow LimitationNotMuffy wrote:(although what the heck does the first "F" stand for?).
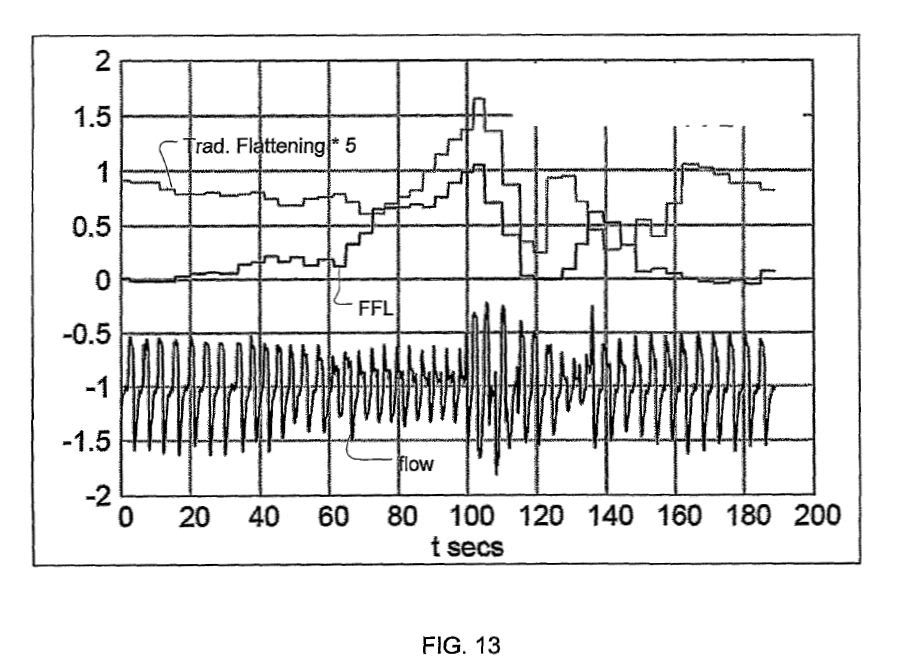
Consequently, it appears the "flip" was done simply to keep the graph on the bottom:Patent wrote:1) as flattening severity increases (e.g., the shape index decreases) the FFL measure increases, 2) where flattening is occurring and ventilation is decreasing, the FFL measure is even more severe, and 3) where ventilation is high (e.g., recovery (big) breaths etc. are occurring) the response to flattening shape index is tempered.