Page 2 of 3
Re: Overnight Pulse Ox Test - Question
Posted: Wed Sep 22, 2010 11:41 am
by Madalot
echo wrote:Oh, I think I understand the misunderstanding. The pulse ox could be flagging two things:
1) A drop in the SPO2 of minimum 4% and stays at the low SPO2 for 10 seconds before it starts to increase again. But then what is the time window of that "drop" to occur?
or
2) A drop of 4% during a window of 10 seconds, after which it increases (or not).
My thinking is that it's the second case. In the case of the first case, then you are right, and the 10 second window would be too large in your case since your low SPO2 doesn't last for minimum of 10 seconds.
Ugh, now *I* am confused!
ROTFLOL -- At least I'm confused with good company!!!
What I'm seeing is that it's taking anywhere from 20-40 seconds for the entire trip, the steps aren't staying at one level for the 10 seconds required to flag it as an event. A drop from 98 - 84 is significant, but because it did it in steps each lasting less than 10 seconds, the monitor didn't register them as events. This makes sense, even though I don't like it.
However, I definitely see where it stayed at 84% for 13 seconds -- that should have been recorded as an event. Right???
Oh, I am SO confused.
Re: Overnight Pulse Ox Test - Question
Posted: Wed Sep 22, 2010 11:41 am
by echo
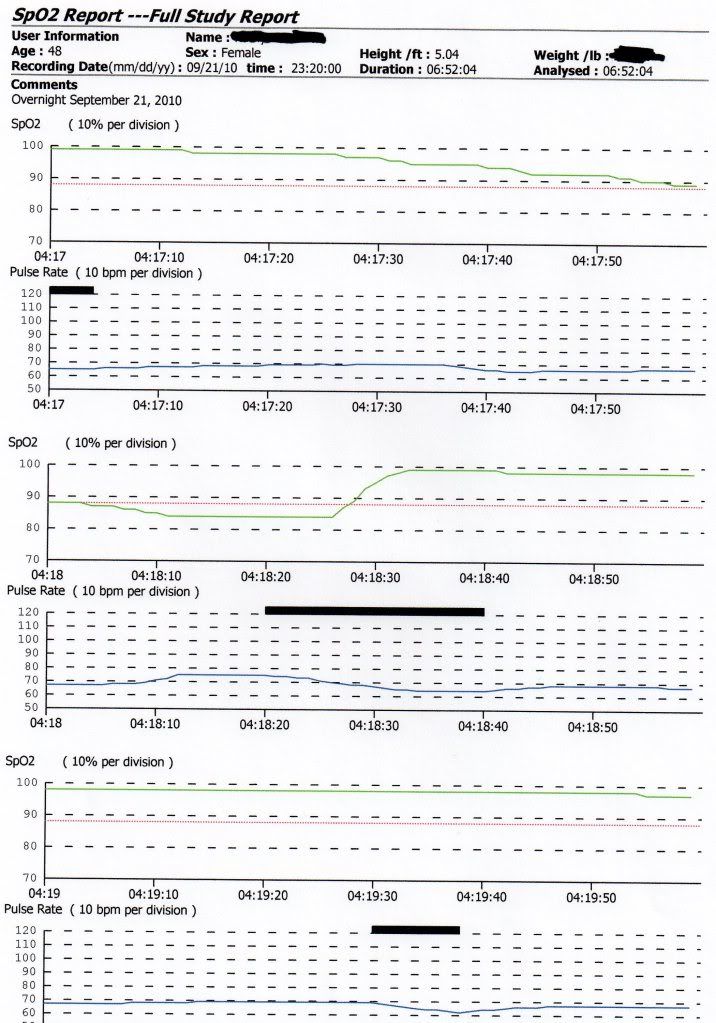
Madalot wrote:I went and looked at one of the three desats and clocked it by seconds where it was obvious there was a change:
4:17:20 -- 98%
4:17:30 -- 97%
4:17:40 -- 94%
4:17:50 -- 92%
4:18:00 -- 88%
4:18:10 -- 86%
4:18:12 -- 84% -- it stayed here until
4:18:25 -- Started back up and peaked
4:18:33 -- at 99%
I would think that when it stayed at 84% for 13 seconds, it should have indicated that as an event???
No, because the previous reading was at 86%, so it doesn't fit the criteria of a 4% drop in 10 seconds! It dropped only 2%.
So I do think you need to increase the window, to 20 seconds, then it should catch each of those drops. No? Easy enough to do if you have the data file.
Re: Overnight Pulse Ox Test - Question
Posted: Wed Sep 22, 2010 11:43 am
by -SWS
So I do think you need to increase the window, to 20 seconds
Well a 20 second window would be less restrictive criterion than the software uses. Any desaturation event meeting that 20-second criterion would fulfill the software's 10-second-minimum criterion. But unfortunately the 20-second window would fail to catch all legitimate 4% or greater desaturation events sustained between 10 seconds and 20 seconds.
And the software, by definition, should score any/all 10-to-20 second sustained 4% drops as well...
Madalot, if you can easily post a screen shot, that would be helpful. If it's a lot of work, then I personally wouldn't bother if I were you.
Re: Overnight Pulse Ox Test - Question
Posted: Wed Sep 22, 2010 11:52 am
by Madalot
-SWS wrote:So I do think you need to increase the window, to 20 seconds
Well a 20 second window would be less restrictive criterion than the software uses. Any desaturation event meeting that 20-second criterion would fulfill the software's 10-second-minimum criterion. But unfortunately the 20-second window would fail to catch all legitimate 4% or greater desaturation events sustained between 10 seconds and 20 seconds.
And the software, by definition, should score any/all 10-to-20 second sustained 4% drops as well...
Madalot, if you can easily post a screen shot, that would be helpful. If it's a lot of work, then I personally wouldn't bother if I were you.
Because to see the trend, it needs to be done in 1-second increments and it would take two screens to show it. I'm happy to do it, but I'm afraid I don't know how to accomplish this. Anybody have a "cliff notes" version of the best way to post screen shots???
Wait a minute -- I might be able to print them this way, but it will take me a few minutes because printing the full report, in the 1 second increments, takes 138 pages. Let me see if I can do this....
Re: Overnight Pulse Ox Test - Question
Posted: Wed Sep 22, 2010 11:57 am
by -SWS
Madalot wrote: Because to see the trend, it needs to be done in 1-second increments and it would take two screens to show it.
Now I'm confused...
If you do this:
At the bottom of the screen you'll see soft buttons for 1, 10, 60, and M. Select the 1 minute intervals instead.
Then you can mentally create a 10-second sliding window in one screen shot--since that one screen shot will be 60-seconds from the graph's far left to far right (x-axis will then have 10-second divisions).
Re: Overnight Pulse Ox Test - Question
Posted: Wed Sep 22, 2010 12:01 pm
by Madalot
-SWS wrote:Madalot wrote: Because to see the trend, it needs to be done in 1-second increments and it would take two screens to show it.
Now I'm confused...
If you do this:
At the bottom of the screen you'll see soft buttons for 1, 10, 60, and M. Select the 1 minute intervals instead.
Then you can see a 10-second sliding window in one screen shot--since that one screen shot will be 60-seconds from the graph's far left to far right (x-axis will then have 10-second divisions).
If I had known when I first got up this morning that I could confuse so many people!!!
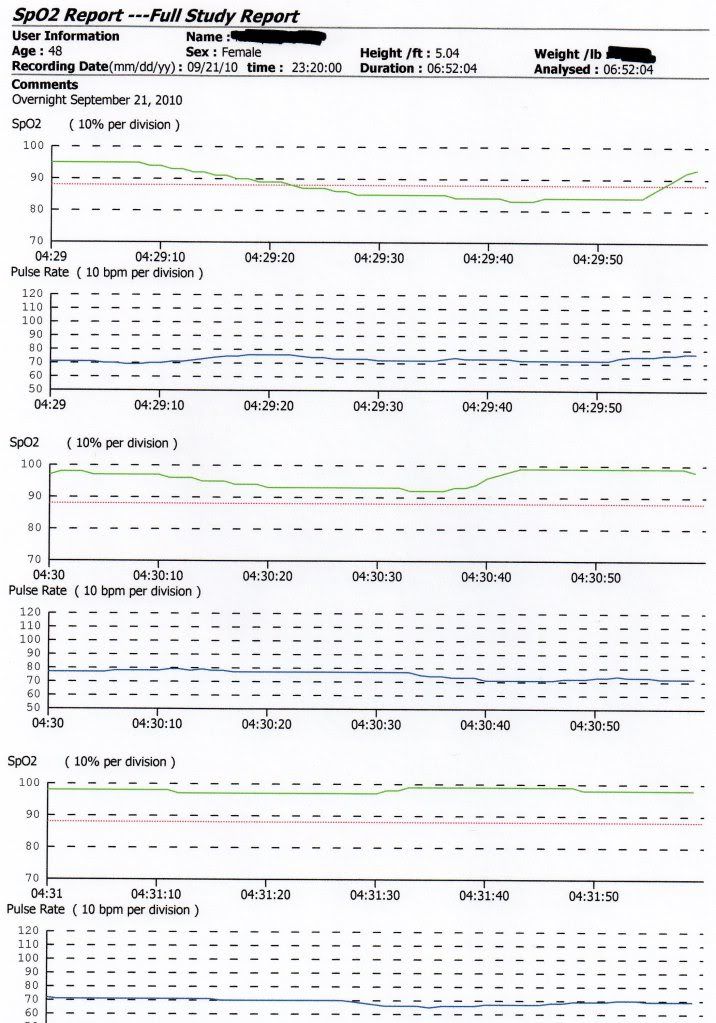
I was able to print the full study report in the 10 second increments. It's harder to discern this way (the screen shot IS better) but would this be helpful? I printed the report pages for the last two desats of the night. It's two pages total to scan and put in here.
Re: Overnight Pulse Ox Test - Question
Posted: Wed Sep 22, 2010 12:05 pm
by -SWS
Okay... Now I understand... You guys were talking about using the "M" soft button to create graphs with 20-second epochs... Whereas I was talking about mentally creating a 10-second scoring "window" using graphs of 1-minute epochs.
I think we were talking about two different kinds of "windows" on the same graph. I very much LIKE the idea of using the "M" soft button to create graphs of 20-second epochs!
Re: Overnight Pulse Ox Test - Question
Posted: Wed Sep 22, 2010 12:15 pm
by Madalot
Here are the two pages: If they really aren't of any help, I'll delete them.
Re: Overnight Pulse Ox Test - Question
Posted: Wed Sep 22, 2010 2:17 pm
by -SWS
Unfortunately those graphs just don't visually seem to "pop" the answer for me, Madalot. By contrast, some of my own graphs seem much more obvious because the downward slopes tend to be sharper---with more immediate subsequent desats that are then sustained relative to prior baseline values. But those same more-obvious examples are also scored by the software as "desaturation events" in my own graphs.
With your gradually-descending SpO2 scores displayed above, the immediate-prior baseline points (that serve as comparison) also meander down in value. And in light of that I suspect the algorithm's simplistic scoring of "desaturation events" is probably "short sighted" or "temporally myopic". A wider recent-average baseline window would avoid that short-sightedness in scoring "desaturation events". Discrete or individual baseline points, on the other hand, make for inherently short-sighted data comparisons.
But I'm also wondering if the software manufacturer intends that temporally short-sighted scoring as an implied software distinction between more gradual hypoventilatory "desaturations" versus more sudden apneic/hypopneic type "desaturation events". And your etiology reflected by those somewhat gradual SpO2 drops, Madalot, just might be more hypoventilatory in nature than that of an upper-airway etiology associated with more common apnea/hypopnea...
Echo, M.D.Hosehead, and others, does anything jump out as obvious on your computer screens? I agree with echo's earlier comment that internal data tables might have been more useful... even though we still don't know some of the software's objective criteria for scoring what the CMS manufacturer terms "desaturation events". I looked through the user manual and marketing literature only to come up empty handed regarding more specific scoring criteria.
Re: Overnight Pulse Ox Test - Question
Posted: Wed Sep 22, 2010 3:21 pm
by LoQ
I have a different pulse oximeter, but I don't believe any of those would be scored as desats on mine, either. Mine requires a 4% drop within a very short time frame and then it must stay down for some period to count as a desat. A gradual decline like what is shown doesn't meet the requirements.
Re: Overnight Pulse Ox Test - Question
Posted: Wed Sep 22, 2010 3:22 pm
by -SWS
Madalot wrote: The report is indicating NO desaturation events, yet it lists my lowest level at 83 and the graph shows about 4 desats below 88%.
Madalot, you might try changing your "desaturation event" scoring criterion from 4% to 3%. I just did that on one of my own saved files, and went from 4 reported events to 22 reported events... Go into settings if you want to try that change.
Re: Overnight Pulse Ox Test - Question
Posted: Wed Sep 22, 2010 4:50 pm
by Madalot
-SWS wrote:Unfortunately those graphs just don't visually seem to "pop" the answer for me, Madalot. By contrast, some of my own graphs seem much more obvious because the downward slopes tend to be sharper---with more immediate subsequent desats that are then sustained relative to prior baseline values. But those same more-obvious examples are also scored by the software as "desaturation events" in my own graphs.
I appreciate your looking at them anyway. Because these graphs are in 10 second increments, the trend is so much more gradual. If you look at the entire night in one graph (like my first report in this thread) the downward trend appears more dramatic.
I'm going to do another regular test tonight and see what tomorrow brings. Like I said before, what's got me a little perplexed is I have about 5 consecutive days of tests showing desaturations on the report. I'm having trouble understanding why last night's was so different. I could see if it listed maybe only 1 or 2 instead of 3 or 4, but to be having 3-4 a night, then suddenly them not being long enough to be recorded -- it just seems odd to me.
But what the heck do I know??? I guess I should be grateful I still wake up every morning and let that be what matters.
Thanks again for reviewing it -SWS, Echo & M.D.Hosehead -- and anyone else that looked that I'm not aware of. I really appreciate the help that was given. It means a lot to me.
Re: Overnight Pulse Ox Test - Question
Posted: Wed Sep 22, 2010 5:01 pm
by Madalot
-SWS wrote:Madalot wrote: The report is indicating NO desaturation events, yet it lists my lowest level at 83 and the graph shows about 4 desats below 88%.
Madalot, you might try changing your "desaturation event" scoring criterion from 4% to 3%. I just did that on one of my own saved files, and went from 4 reported events to 22 reported events... Go into settings if you want to try that change.
I just noticed this post (sorry) and did it. It went from 0 events to 6 with the criteria reduced to 3%. It said I spent 3 minutes total in events, with the average event being 29.5 seconds.
Re: Overnight Pulse Ox Test - Question
Posted: Wed Sep 22, 2010 8:08 pm
by Madalot
LoQ wrote:I have a different pulse oximeter, but I don't believe any of those would be scored as desats on mine, either. Mine requires a 4% drop within a very short time frame and then it must stay down for some period to count as a desat. A gradual decline like what is shown doesn't meet the requirements.
Thank you for this LoQ -- I think this is exactly what happened with my monitor. Like I've said, I was a little taken aback because I've never had the report indicate 0 events, yet still have desaturations that low. But thanks to everyone here, I learned how to really look at the data and really get to the "meat" of what's happening, regardless of what the report actually says.
Thank you again, for the input.
Re: Overnight Pulse Ox Test - Question
Posted: Wed Sep 22, 2010 8:54 pm
by M.D.Hosehead
-SWS wrote:
Echo, M.D.Hosehead, and others, does anything jump out as obvious on your computer screens?
I'm no expert in oximeters and how they work.
But to me, it looks like a clinically significant desaturation didn't get flagged.
I tried the following with my 50D+. I held my breath for about as long as I could--2 minutes--and wrote down the O2 sats every 10 seconds. There was no drop in O2 sat for the first minute; during the second minute, the O2 sat gradually declined from 98 to 88%. When I started breathing again (gasping, really) the O2 sat was back to 96% by 30 seconds. If this isn't clear, I'll be glad to post the numbers, or you can try the experiment on your oximeter.
In other words, I had a total obstruction, and if I had plotted my O2 sats. against time, the curve would have looked very much like the ones Madalot posted. No matter how the proprietary algorithm is supposed to work, If that desat wasn't flagged as an event in Madalot's report, then it seems to me there's something wrong with the oximeter itself, the oxy's attachment to the finger, the oxy's communication with the computer, or the software.
It's the only explanation I can think of that fits the facts. If the green line is
valid, the flags and computations cannot be correct. If the green line is
not valid, either the machine or your finger must be defective.
The first 50D+ I received was defective and had to be replaced. In my case, the 50D+ wouldn't send data to the SpO2 application (the one with the green icon) even though it would send instantaneous data to the app with the red icon (I forgot its name).