Page 3 of 3
Re: What's going on with my spO2 dips? ASV.
Posted: Wed Dec 31, 2014 1:45 am
by archangle
What version of SleepyHead are you using? It's listed at the top of the window.
This one looks a lot more like a real event with the "real" looking pulse change corresponding to the O2 drop, but you really need to zoom in a lot more so we can see the time scale a lot better.
Apneas will tend to increase BPM as well as drop SpO2.
Re: What's going on with my spO2 dips? ASV.
Posted: Wed Dec 31, 2014 9:08 am
by icipher
archangle wrote:What version of SleepyHead are you using? It's listed at the top of the window.
This one looks a lot more like a real event with the "real" looking pulse change corresponding to the O2 drop, but you really need to zoom in a lot more so we can see the time scale a lot better.
Apneas will tend to increase BPM as well as drop SpO2.
Tonight when I get home, i'll do a zoom-in and upload it here.
Re: What's going on with my spO2 dips? ASV.
Posted: Wed Dec 31, 2014 10:43 am
by pbriggs
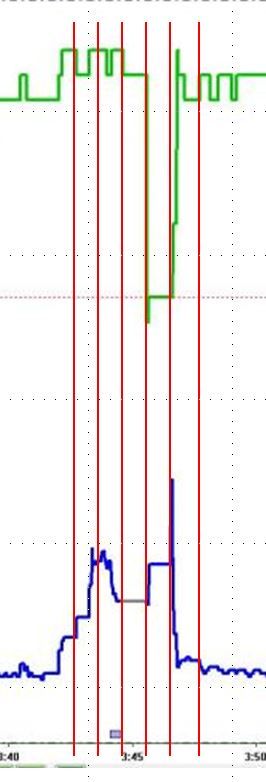
It is a most interesting graph for me with a few items to note - based on the zoomed in data provided so far I see:
1. the overall pulse change event is just under 5 minutes in duration (4 minutes 30 seconds is my estimate by scale)
2. the SpO2 event starts at the end of an
open event shown on the pulse scale (more on that shortly)
3. the SpO2 event lasts just about exactly 1 minute
So - lets start with the pulse event. At about 2 minutes into the event you need to note the color change in the graph. The line changes from blue to grey. The grey line indicates that the data is not actually recorded data - so the signal was lost. This is very common with movement. The signal is lost of about 1 minute. A very long time in my opinion based on my data. So this appears to me that you moved around a lot at 3:42am possibility that you changed sleeping positions a few times in a row and the SpO2 device lost the signal.
The red lines are just about 1 minute apart -
So you would need to look at the machine data for around 3:42 am and see what is shows - it would be nice to see the machine data from 3:40am to 3:47am to get an idea if anything shows in the same time.
For me - I think it is an artifact in my opinion based on the open signal shown in grey - without any other supporting graphs....
EDIT - for me if I roll around a lot in bed at night my pulse rate goes higher for a few minutes depending on how much I move around
Re: What's going on with my spO2 dips? ASV.
Posted: Wed Dec 31, 2014 1:37 pm
by HoseCrusher
Keep in mind that a movement artifact usually effects both O2 and pulse graphs.
The algorithm used involves smoothing data. Another explanation of the break in pulse data is that the data was outside the "norms" used for the smoothing. When this occurs the data has to be collected for a period of time to establish new "norms" and then to resume graphing.
For example when people go into fibrillation they can see the heart rate go from something like 50 - 60 BPM to something over 200 BPM. This spike can disrupt the graphing.
I hope this is an artifact but if it keeps coming up I think it is worth looking a little further into.
Re: What's going on with my spO2 dips? ASV.
Posted: Fri Jan 02, 2015 2:19 am
by archangle
icipher wrote:Tonight when I get home, i'll do a zoom-in and upload it here.
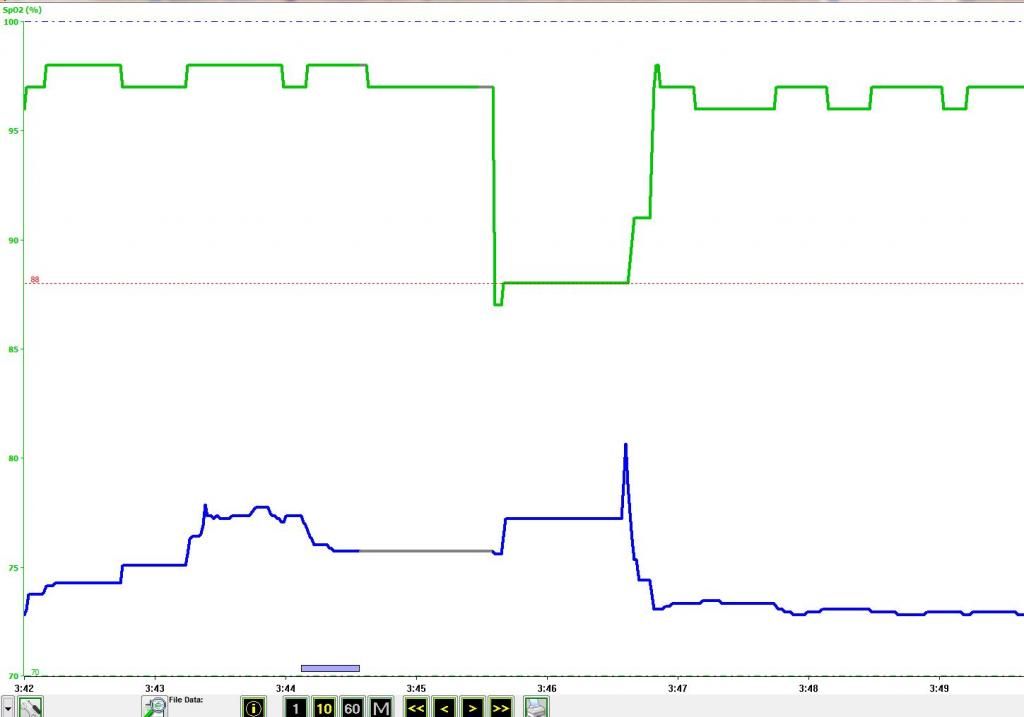
Zoom in on the SpO2 review program to the 1 minute view and show the edge of the drop, so we can see how quickly it went down.
The gray bit on the BPM does support the idea that it's an artifact.
I'll also note that even if your SpO2 actually dropped, it's not that low or that long.
Re: What's going on with my spO2 dips? ASV.
Posted: Sat Jan 03, 2015 2:42 pm
by icipher
archangle wrote:icipher wrote:Tonight when I get home, i'll do a zoom-in and upload it here.
Zoom in on the SpO2 review program to the 1 minute view and show the edge of the drop, so we can see how quickly it went down.
The gray bit on the BPM does support the idea that it's an artifact.
I'll also note that even if your SpO2 actually dropped, it's not that low or that long.
Is this close enough?
Re: What's going on with my spO2 dips? ASV.
Posted: Mon Jan 05, 2015 2:56 am
by archangle
icipher wrote:archangle wrote:icipher wrote:Tonight when I get home, i'll do a zoom-in and upload it here.
Zoom in on the SpO2 review program to the 1 minute view and show the edge of the drop, so we can see how quickly it went down.
The gray bit on the BPM does support the idea that it's an artifact.
I'll also note that even if your SpO2 actually dropped, it's not that low or that long.
Is this close enough?
I say glitch. The gray segment on the SpO2 chart means bad data. It looks like your SpO2 reading dropped 10% in a few seconds, which isn't possible. Zoom in to one minute and see how many seconds it took for SpO2 to fall off that cliff.
