420E Run Question ???

General Discussion on any topic relating to CPAP and/or Sleep Apnea.
User avatar
ozij
Posts: 10191
Joined: Fri Mar 18, 2005 11:52 pm

When probability fails....

Post by ozij » Mon May 26, 2008 11:07 pm

One of the most impressive things in tangents' charts is the way her breathing cycles, runs and event correlate. When she snores, her cycles go all the way down, You can see it very clearly in her constant pressure chart.

Image

When she runs she snores (...) and her cycles hit rock bottom.

Not so with me.

Image


I rarely snore (on cpap).
Many - maybe most of my events do not correlate with my cycle states - so much so that I stopped looking at that data and thought it was another bug. And the cycle state rarely reaches the bottom, if it does, it never stays there. This is true of both APAP and CPAP: I ran a min=max=my recommended for about a week last year - (it was disaster) and none of my events had much to do with either runs or cycles. Nothing looked like Cathy's up down.

Not so to with RG's data
Image

In her recent min.= 7 experiment, she was snoring and having hypopneas, and her cycles were chugging along very near to top, obliviuosly - nothing like Cathy's cycles.

Not so with Bill's data
His cycles too have this fluctuating look most of the time (and hes' not snoring under therapy).

I suggest that anyone with that kind of constantly fluctuating cycle pattern needs IFL1 turned off, because the machine is getting false positive flow limitation runs on intermediate breaths, and is not capable of identifying whether pressure is needed or not.


And to return to Bill's original observation: Why do I have more runs when I cut the range? The answer is statisitics: The algorithm uses a Pearson correlation coefficient. When that statisitic has a more varied sample of breaths to work with, it gets a valid correlation. Correlation is lost (for mathematical reasons) when the variance drops. I'm not sure of the formal statistical term in English, in Hebrew that statistical phenomenon is called "cutting the range". Cutting the pressure range drops the breaths variance (for some of us) and we get wrong interpretations of our breathing patterns. Hence a built in option to turn IFL1 off.

O.

edited to add charts.
_________________

CPAPopedia Keywords Contained In This Post (Click For Definition): CPAP, APAP

_________________
Mask: AirFit™ P10 Nasal Pillow CPAP Mask with Headgear
Additional Comments: Machine: Resmed AirSense10 for Her with Climateline heated hose ; alternating masks.
Last edited by ozij on Tue May 27, 2008 3:46 am, edited 2 times in total.
And now here is my secret, a very simple secret; it is only with the heart that one can see rightly, what is essential is invisible to the eye.
Antoine de Saint-Exupery

Good advice is compromised by missing data
Forum member Dog Slobber Nov. 2023

User avatar
Snoredog
Posts: 6399
Joined: Sun Mar 19, 2006 5:09 pm

Post by Snoredog » Tue May 27, 2008 1:32 am

NightHawkeye wrote:
-SWS wrote:Bill, right about now I'm leaning toward thinking your 420e FL runs are probably nothing to worry about.
Well, I think you missed my drift, -SWS. The FL runs, per se, have never been as much a concern as an indicator. But, an indicator of what? Hence, the questioning title of this thread.

Rapoport apparently missed the boat a little in terms of applying flow-limitation to the general apnea population, but I suspect that for many people, yourself apparently included, the 420E with its flow-limitation algorithm provides noticeably better treatment than ResMed or Respironics machines can. While I might wish that I were included in that population, I will gladly settle for what information the flow-limitation sensing algorithms can provide.

I kinda like to connect the dots anyway. It's something I do in my own work and the approach has served me well over the past few years; not just in regards to my own apnea treatment but also understanding my own unique health care needs.

Yes, I am pleased with my AHI right now and certainly feeling the better for it; but also wanting even more. I would surely like to get better sleep and more of it. I kinda feel like I'm on the verge of making additional improvement there. (Not to mention that I'd like to improve my overall health some but, hey, I'm working on that too! ) This whole discussion thread, like so many here at cpaptalk, has offered some real possibilities; while some play out, some pan out. It just takes one or two to make the whole process immensely worthwhile.

Regards,
Bill
as I mentioned before if you are a shallow breather that can drive a machine nutso, if you have it turned off from responding to those I wouldn't worry about it either, but I would suggest hooking your pulse-oximeter up for a night or two and making sure you are not putting your heart under any stress and it would be interesting to see what your heart rate and O2 levels are looking like.

If the pulse oximeter readings look okay and heart rates stays well below 100 I wouldn't worry about it.

someday science will catch up to what I'm saying...

-SWS
Posts: 5301
Joined: Tue Jan 11, 2005 7:06 pm

Post by -SWS » Tue May 27, 2008 8:02 am

What a cool compilation of charts, ozij! Thanks for bringing those!! Also before I forget I'd like to thank Bill for his once-again great listing and summary of relevant patent descriptions.
ozij wrote:And to return to Bill's original observation: Why do I have more runs when I cut the range? The answer is statisitics: The algorithm uses a Pearson correlation coefficient. When that statisitic has a more varied sample of breaths to work with, it gets a valid correlation. Correlation is lost (for mathematical reasons) when the variance drops.
I don't suspect that Bill's FL runs can be attributed to dropped sample-variance associated with the Pearson Correlation Coefficient method. I say that simply because the data sample is 100%, regardless of how narrow Bill sets his 420e pressure range. Rather than data variance getting inadvertently dropped from Bill's collection sample, variant breaths are what diminish with that narrower pressure range (not the breath sample collection).
ozij wrote:Not so with Bill's data
His cycles too have this fluctuating look most of the time (and hes' not snoring under therapy).

I suggest that anyone with that kind of constantly fluctuating cycle pattern needs IFL1 turned off, because the machine is getting false positive flow limitation runs on intermediate breaths, and is not capable of identifying whether pressure is needed or not.
One of my initial thoughts as well. However, Bill's tabular data shows the largest percentage of his respiratory cycles being data-returned as "normal". The next largest percentage of his respiratory cycles are data-returned as frank "flow limited". Finally, very few of Bill's respiratory cycles are data-returned as "intermediate" flow-limited. Admittedly that summarized tabular data may be in error (i.e. a summary-type software bug is possible).


I'd like to step through the above charts and comment as well. But warning: I could end up being really REALLY wrong with my comments! But that's the fun of learning!


Thanks again, ozij!!!


User avatar
Snoredog
Posts: 6399
Joined: Sun Mar 19, 2006 5:09 pm

Re: When probability fails....

Post by Snoredog » Tue May 27, 2008 9:02 am

ozij wrote:One of the most impressive things in tangents' charts is the way her breathing cycles, runs and event correlate. When she snores, her cycles go all the way down, You can see it very clearly in her constant pressure chart.

<snipped>

When she runs she snores (...) and her cycles hit rock bottom.

Not so with me.

<snipped>
I disagree, you appear to be reading that chart backwards, there are fewer FL runs seen when that graph is at the top not the bottom, at the bottom where your green arrows are that is the worst. You can see that in periods where their are virtually no FL runs, that graph line is at the top.

If you look at the top graph in the last 1.5 hours of that session you will see the Acoustical vibrations and the FL run hit rock bottom. During that last 1.5hrs period towards the end of the session Cathy had the fewest FL runs and snoring with only a few apnea and 1 CA seen.

Where you placed "green" arrows that indicates Flow Limited Cycles, the more "Normal" the cycle is (less severity) the higher that Run line will be. Where there are no FL runs detected that line is at the top of the graph.

What you have to deciper is Normal (at the top) to "Invalid cycle" at the bottom (where green arrows are), just as displayed on the Silverlining report you have:

Cycle
Normal Cycle : 80%
intermediate cycle: 8%
Flow Limited cycle:13%
Invalid cycle:0%

Obviously you have to know from that graph of runs what those cycles look like, from the above you can only conclude when there are "no" FL runs and the graph is at the top that those periods are "Normal", when things become a train wreck and solid bars like Bill's that those cycles are either Flow Limited or Invalid (when at the bottom of the line graph plot).

Note: The only correlation I see is between "Runs" and "Cycles" is the more solid the "Runs" get the greater the cycles states seen.

In RG's graph, fewer FL runs are seen at your green arrows and the "cycles" line is at the top which is what I would consider to be "Normal".

By contrast to RG's, in Bill's charts his FL "Runs" graph is nearly solid blue the "opposite" of what you want. I would prefer a chart that looks like Cathy's to Bill's any day.

The more "Normal" your FL cycles become the higher that line graph will be and fewer "blue" tics the better.

Cathy's up and down cycles (very top graph):

Her pressure is a constant 10 cm so you have no influence on changing pressure impacting what you are looking at.

IF you observe the time line from the left start of the session those "Flow Limited" cycles appear approximately every 90 minutes indicating to me periods of REM sleep, that is where I would expect to see any more severe periods of Flow Limited cycles is during REM.

Wished the therapy hour bar at top was included in that graph to more easily identify the parts of the graph, but if I count the worst "cycles" period seen on Cathy's chart I get 5 periods of REM with the last cycle being short. So I would conclude from that chart she had 5 periods of REM sleep and those 5 high cycles "periods" came from being in REM sleep and since pressure was static the machine was unable to reduce those FL periods seen.

But I would change nothing on her machine settings her therapy seems fine to me.

Note: You should be able to spot these same periods of "REM" by circling the clusters of "Runs" seen on Cathy's chart.

Now the question becomes if those higher periods or clusters of "Runs" represent periods of REM, what the heck is going on with Ozij's, Bills and Adrian's charts where the Flow Limited "Run" is nearly a solid bar.

I have always seen fewer FL runs associated with better quality of sleep, that also meant fewer cycles seen on the cycles line.

Obviously on Cathy's where pressure is static you can see the pattern, but where the pressure goes up and down it seems those runs and cycles fluctuate with the pressure, as pressure goes down runs and cycles increase which makes sense to me, I would expect that to happen.

Pressure may not be high enough; I see an obstructive event like Flow Limitation as period right before a snore becomes audible. If you increase pressure to eliminate the snore, you continue to increase to eliminate the FL. But since FL generally are not associated with an arousal or reduced oxygen they have always been left alone in the past as they do no harm.

Would sleep improve if pressure was increased to eliminate those FL runs? At some point after you eliminate snores you can over titrate, you have to stop somewhere just like they do in the sleep lab.

someday science will catch up to what I'm saying...

-SWS
Posts: 5301
Joined: Tue Jan 11, 2005 7:06 pm

Post by -SWS » Tue May 27, 2008 10:32 am

Do we all agree that the "cycle states" graph is:

1) a regression type curve fit for scattered individual-cycle FL data points,
2) has nothing to do with collected A, H, or AV data (but may correlate), and
3) exclusively reflects returned FL status for each breath with respect to: a) "normal" non-FL cycles, b) "intermediate" FL cycles, and 3) frank "FL" cycles?

So the cycle states graph, the FL Runs line immediately above it, and the tabular FL summary data are best read together. But the fact that the cycle-states graph is a curve fit of scattered points can make it misleading if there is very tightly-dispersed variance in the individual or cycle-related FL data points.

When I look at Bill's tabular or summary FL data, for instance, I see very few intermediate cycles. Yet, when I look at Bill's cycle states graph, I see that curve very often hovering near the mid zone. As snoredog and ozij have both pointed out, the cycle states graph has roughly three zones of interest: 1) normal non-FL breaths graphically hover in the top zone, 2) sustained intermediate FL cycles should graphically hover near the middle zone, and 3) sustained frank "FL" cycles should graphically hover near the bottom.

But Bill's graphical cycle-states data reflect plenty of graphed curve near the middle zone---while his summarized tabular data reflects very few intermediate FL cycles. Are those two at odds? They may be at odds because of a data-reporting software error, but I kind of doubt that in this case. Bill's frank FL runs might not be sufficiently sustained over time to send his cycle-states regression curve to the bottom. It is possible that Bill's normal cycles and FL cycles reflect tightly-dispersed variance such that his regression curve hovers near the middle---making it appear as if he spends much more time in the intermediate cycle states than he actually does.

So if the SL3 data reporting is not in error, I think Bill's charts reflect short-duration FL oscillations---or at least something that is reported as FL (whatever it may be). Anyway, IMO Bill's data underscores why it is important to read all three FL data sets together.

And if Bill's FL runs genuinely reflect something that happens to be SDB related, we might speculate that his SDB pattern reflects a "short-cycling" disorder of some type---if it reflects disorder at all that is...

User avatar
Snoredog
Posts: 6399
Joined: Sun Mar 19, 2006 5:09 pm

Post by Snoredog » Tue May 27, 2008 11:07 am

-SWS wrote:Do we all agree that the "cycle states" graph is:

1) a regression type curve fit for scattered individual-cycle FL data points,
2) has nothing to do with collected A, H, or AV data (but may correlate), and
3) exclusively reflects returned FL status for each breath with respect to: a) "normal" non-FL cycles, b) "intermediate" FL cycles, and 3) frank "FL" cycles?

So the cycle states graph, the FL Runs line immediately above it, and the tabular FL summary data are best read together. But the fact that the cycle-states graph is a curve fit of scattered points can make it misleading if there is very tightly-dispersed variance in the individual or cycle-related FL data points.

When I look at Bill's tabular or summary FL data, for instance, I see very few intermediate cycles. Yet, when I look at Bill's cycle states graph, I see that curve very often hovering near the mid zone. As snoredog and ozij have both pointed out, the cycle states graph has roughly three zones of interest: 1) normal non-FL breaths graphically hover in the top zone, 2) sustained intermediate FL cycles should graphically hover near the middle zone, and 3) sustained frank "FL" cycles should graphically hover near the bottom.

But Bill's graphical cycle-states data reflect plenty of graphed curve near the middle zone---while his summarized tabular data reflects very few intermediate FL cycles. Are those two at odds? They may be at odds because of a data-reporting software error, but I kind of doubt that in this case. Bill's frank FL runs might not be sufficiently sustained over time to send his cycle-states regression curve to the bottom. It is possible that Bill's normal cycles and FL cycles reflect tightly-dispersed variance such that his regression curve hovers near the middle---making it appear as if he spends much more time in the intermediate cycle states than he actually does.

So if the SL3 data reporting is not in error, I think Bill's charts reflect short-duration FL oscillations---or at least something that is reported as FL (whatever it may be). Anyway, IMO Bill's data underscores why it is important to read all three FL data sets together.
agreed. And I see Bill's results (even though his AHI is lower) is not what I'd want to see on my 420e's reports, I see that as a sign of over titration.

someday science will catch up to what I'm saying...

User avatar
tangents
Posts: 750
Joined: Thu Mar 08, 2007 11:03 am
Location: Cleveland, Ohio

Post by tangents » Tue May 27, 2008 12:01 pm

Image

This thread is making my brain hurt! I missed a few days and - Whew! - what a lot to catch up on!

OK, so I think the meaning of "Runs" and "Cycle States" is getting clearer for me, but I sure wouldn't want to have to explain it to anyone else.

I'm wondering if the flow limiting algorithm returns either a YES or a NO. With this interpretation, a graph hovering in the middle would indicate 50% of breaths are flow limited, and 50% are not. If there were a "partial flow limited" possibility, I would expect a 3-tier graph with values like 0 (flow limited), 1(Partial flow limited), and 2(normal). But we seem to get all values between the bottom and the top, like a percentage of normal to flow limited would yield.

BTW, about my REM. Both my sleep studies indicated a tendency for late REM onset (Like 240 minutes). If that's true, I don't think the flow limited portions of my graphs indicate REM. But then again - it might have been hard to dream with all those wires hooked up to me...

Great discussion - lots of good ideas and theories.

Regards,
Cathy

User avatar
NightHawkeye
Posts: 2431
Joined: Thu Dec 29, 2005 11:55 am
Location: Iowa - The Hawkeye State

Post by NightHawkeye » Tue May 27, 2008 12:30 pm

-SWS wrote:Do we all agree that the "cycle states" graph is:

1) a regression type curve fit for scattered individual-cycle FL data points,
2) has nothing to do with collected A, H, or AV data (but may correlate), and
3) exclusively reflects returned FL status for each breath with respect to: a) "normal" non-FL cycles, b) "intermediate" FL cycles, and 3) frank "FL" cycles?
I agree with the first two. To be honest though, I simply don't know about item 3), but I'm happy to assume that it's right because the data being reported from SilverLining matches those categories.
-SWS wrote:It is possible that Bill's normal cycles and FL cycles reflect tightly-dispersed variance such that his regression curve hovers near the middle ...
Your theory about tightly dispersed variance makes a lot of sense to me, -SWS. One possibility which "might" account for that is that the Comfort Curve mask I use requires the pressure sensing tube to be located at a much greater distance from my face than it would be with most other masks. Also, much smaller tubes are used for that final 8-10 inches to the mask. The result is that pressure variations at the sensing tube are reduced compared with pressure variations closer to the face. Whether that's enough to cause the effect seen is unknown. What seems certain though is that PB wouldn't have used the long sensing tube if it wasn't needed, and an extra 8 inches or so through constricted tubing sure doesn't help the measurement capability any.

I'm thinkin' the old Swift mask is gonna get a work-out tonight. (Place your bets, now ... )

Regards,
Bill


-SWS
Posts: 5301
Joined: Tue Jan 11, 2005 7:06 pm

Post by -SWS » Tue May 27, 2008 1:15 pm

LOL! I agree, Cathy! This is a "brain ouchy" thread for sure. And if the old saying "no pain, no gain" can be translated to "no brain-pain, no gain"... then I sure have extremely high hopes for this thread!

Here's what Silver Lining 3 says about cycle status, for anyone who's interested:
Silver Lining 3 on-line manual wrote: The analysis of the flow form during the inspiration computed at each respiratory cycle allows their classification in Normal (N), Intermediate (I) or at Flow Limitation (FL). On the trend trace, the higher the trace, the closer the inspiratory cycles are to normal (N). Conversely, a low trace indicates a trend of Flow Limitation (FL). A median trace indicates a trend of intermediate cycles (I).
So Bill ends up with plenty of mid-zone or median traces on his graph while his summary table shows very low percentages of intermediate cycles. I agree with you, Cathy. I think regression curve fitting of tightly-packed FL and N variance (short-cycle FL/N oscillations) very often place his curve trace right in the middle.

-SWS
Posts: 5301
Joined: Tue Jan 11, 2005 7:06 pm

Post by -SWS » Tue May 27, 2008 1:47 pm

NightHawkeye wrote:One possibility which "might" account for that is that the Comfort Curve mask I use requires the pressure sensing tube to be located at a much greater distance from my face than it would be with most other masks. Also, much smaller tubes are used for that final 8-10 inches to the mask. The result is that pressure variations at the sensing tube are reduced compared with pressure variations closer to the face. Whether that's enough to cause the effect seen is unknown.
If that does happen to contribute to the effect, Bill, then I'm thinking that it should contribute indirectly. That small sensor line is hooked up to the pressure transducer. The 420e flow sensor (pneumotachograph) uses the main CPAP hose for its signal conduit.

So direct sensing of FL should be unaffected by the narrow sensor line. However, the monitoring of pressure changes that are administered at the mask stands potential for skew---and that, in turn, can conceivably impact therapy in extreme pressure-signal affecting circumstances I would think.

I look forward to seeing what the Swift does to your data! I'm also admittedly wondering what might happen to your FL data if you ever slept upright in a recliner. I kinda doubt that would really matter to your FL runs, though... Never know!

.


User avatar
NightHawkeye
Posts: 2431
Joined: Thu Dec 29, 2005 11:55 am
Location: Iowa - The Hawkeye State

Post by NightHawkeye » Wed May 28, 2008 7:08 am

-SWS wrote:I look forward to seeing what the Swift does to your data! I'm also admittedly wondering what might happen to your FL data if you ever slept upright in a recliner. I kinda doubt that would really matter to your FL runs, though... Never know!
OK, here's data from the last two nights with two different masks:
Image

I ended up using the Comfort-Lite 2 mask rather than the Swift because the Swift didn't look any better than the Comfort Curve in regards to flow resistance. Interestingly, there don't seem to be any significant distinctions between the "runs" for either night, although the two nights are distinctively different from most of the preceding nights. I changed three parameters two days ago which show up in this data: MaxPressure=12 (from 10.5), Command_On_Apnea=11 (from 10), and Initial_Pressure=9.5 (from 8 ).

At the risk of over-analyzing this, a couple of things stand out. First, the runs presented in this data are more similar to the runs presented much earlier, when the APAP was set to a wide range, than they are to the past month's worth of narrow-pressure-range data. Second, the runs in last night's data correlate with both the pressure increases and the occurrence of apneas and hypopneas. Having slept well last night, my over-active right-sided imagination pounces on this, concluding there's maybe a connection with both mask-type, as I hypothesized earlier, and command-on-apnea.

Perhaps it's too early to tell though, that's what the left-side of my brain says. The right-side responds, however, with look at the data! (I'm conflicted.)

I'm also thinking an extension to the pressure sensing tube, for use with the Comfort Curve mask would be an interesting experiment, and very easy to implement.

Regards,
Bill


User avatar
ozij
Posts: 10191
Joined: Fri Mar 18, 2005 11:52 pm

Post by ozij » Wed May 28, 2008 7:39 am

-SWS wrote:I don't suspect that Bill's FL runs can be attributed to dropped sample-variance associated with the Pearson Correlation Coefficient method. I say that simply because the data sample is 100%, regardless of how narrow Bill sets his 420e Rather than data variance getting inadvertently dropped from Bill's collection sample, variant breaths are what diminish with that narrower pressure range (not the breath sample collection).

That is my point. I did not think there was any problem in sampling the breaths rather that with a narrow range, they are less varied.
Patent no. 6,488,634 wrote:The determination of the degree of flow limitation present is based on four shape detection parameters, the sinusoidal index, the flatness index, the respiratory effort index and the relative flow magnitude index. The sinusoidal parameter or index is calculated as a correlation coefficient of the actual total inspiratory flow wave (filtered) to a reference sinusoidal half wave. As shown in FIG. 13, a half sinusoidal template 50 that matches the timing and amplitude of the actual total inspiratory flow data is compared to the actual total inspiratory flow data, for example, using a standard Pearson product moment correlation coefficient. This correlation coefficient is an index ranging from 1 (sinusoidal or not flow limited) to 0 (not sinusoidal).
If the actual total inspiratory flow data has less variable breaths, the correlation with a sinusoidal index drops, therefore all breaths will be given a lower sinusoidal index, etc. and there would be more flow limitations.

-SWS wrote: Do we all agree that the "cycle states" graph is:

1) a regression type curve fit for scattered individual-cycle FL data points,
2) has nothing to do with collected A, H, or AV data (but may correlate), and
3) exclusively reflects returned FL status for each breath with respect to: a) "normal" non-FL cycles, b) "intermediate" FL cycles, and
3) frank "FL" cycles?
I agree with 2 and 3 - not sure if I understand why this has to be a "regression type curve".
-SWS wrote:Bill's frank FL runs might not be sufficiently sustained over time to send his cycle-states regression curve to the bottom.
Agreed - paradoxically, even though the software shows Bill, RG and myself as having many flow limitation runs we do not have such sustained deep flow limitations.
tangents wrote:I'm wondering if the flow limiting algorithm returns either a YES or a NO
That's how I understand figure 13 mentioned above. http://www.google.com/patents?id=-Q8KAA ... 34#PPA8,M1

Patent no. 6,488,634 wrote:FIG. 16 shows the prior probability factor which is applied to the initial value of the flow limitation parameter calculated from the shape parameters to yield a final value for the current valid breath. The prior probability factors are used to modify the flow limitation parameter based on previous breath's value for flow limitation. The underlined value is an estimate of the best value to be used as a multiplicative or additive to the index. Thus, the flow limitation parameter is made more important when other flow limited breaths have been detected. Similarly, the index is made less "flow limited" if the present occurrence is an isolated incident.

If the flow limitation parameter is between 1 and a predetermined normal reference value, e.g., 0.65-0.8, then the breath is classified as "normal." If the flow limitation parameter is between 0 and a predetermined flow limited reference value, e.g., 0.4, then the breath is classified as "flow limited." If the flow limitation parameter is between the normal and flow limited reference values, then the breath is classified as "intermediate."
By definition, we get a (calculated, albeit not valid) flow limitation cascade.
The above patent wrote:One method for adjusting the CPAP pressure in accordance with the invention is illustrated in FIG. 10. After the CPAP mask has been fitted to a patient and the CPAP generator has been connected to the mask (step 40), the CPAP pressure is set at a starting pressure. This pressure is a pressure at which flow limitation for the patient does not occur. After a settling period of about 30 seconds (step 41), the flow signal is analyzed (step 42).
-SWS wrote:However, Bill's tabular data shows the largest percentage of his respiratory cycles being data-returned as "normal". The next largest percentage of his respiratory cycles are data-returned as frank "flow limited" .
Same with me (2% intermediate), same with RG (2% intermediate), same with Peggy (3% intermediate). I think the cycles states may describe "the initial value of the flow limitation parameter calculated from the shape parameters", wheres the table is based on the calculations after applications of the prior probablililty.

_________________

CPAPopedia Keywords Contained In This Post (Click For Definition): cpap mask, 420E, CPAP

_________________
Mask: AirFit™ P10 Nasal Pillow CPAP Mask with Headgear
Additional Comments: Machine: Resmed AirSense10 for Her with Climateline heated hose ; alternating masks.
Last edited by ozij on Wed May 28, 2008 9:50 am, edited 1 time in total.
And now here is my secret, a very simple secret; it is only with the heart that one can see rightly, what is essential is invisible to the eye.
Antoine de Saint-Exupery

Good advice is compromised by missing data
Forum member Dog Slobber Nov. 2023

User avatar
tangents
Posts: 750
Joined: Thu Mar 08, 2007 11:03 am
Location: Cleveland, Ohio

Post by tangents » Wed May 28, 2008 9:11 am

At the risk of over-analyzing this, a couple of things stand out. First, the runs presented in this data are more similar to the runs presented much earlier, when the APAP was set to a wide range, than they are to the past month's worth of narrow-pressure-range data. Second, the runs in last night's data correlate with both the pressure increases and the occurrence of apneas and hypopneas. Having slept well last night, my over-active right-sided imagination pounces on this, concluding there's maybe a connection with both mask-type, as I hypothesized earlier, and command-on-apnea.
Bill,

I respectfully disagree. This data looks much better to me than the chart on page 1 with the wide pressure range. First of all, the runs are intermittent, rather than a solid bar. Second, you have less apneas/hypopneas than before. I think you're closing in on your sweet spot!

Also, I see the pressure increases corresponding to your APNEAS, not your runs. Big difference. You want the PAP to keep the runs from starting by increasing your lower pressure setting, which you did. But you don't necessarily want your maching to "chase" the runs - only the apneas/hypopneas. Your leaks look great here, too. I think you should try these settings with the CL-2 for a week or so, and see if you get consistent results. I'm happy for you - to me it seems like you've made great progress!

Have a Great Day,
Cathy


User avatar
NightHawkeye
Posts: 2431
Joined: Thu Dec 29, 2005 11:55 am
Location: Iowa - The Hawkeye State

Post by NightHawkeye » Wed May 28, 2008 9:36 am

tangents wrote:I respectfully disagree. This data looks much better to me than the chart on page 1 with the wide pressure range. ... I'm happy for you - to me it seems like you've made great progress!
Actually, I agree with you totally, Cathy. Communication is not my strong suit though , so I apologize for clumsy wording on my part. I think the data this morning looks like I may be closing in on the sweet spot, too!

Regards,
Bill

-SWS
Posts: 5301
Joined: Tue Jan 11, 2005 7:06 pm

Post by -SWS » Wed May 28, 2008 2:00 pm

Snoredog, just to let you know that I'm definitely not ignoring your comments! As usual I'm soaking your interpretations in since you "nail it" so often.

However, I'm not so sure I agree with your REM conclusion. Not that yours is a wrong conclusion regarding REM. It's just that I think the amount of information available is inconclusive regarding how much REM Cathy incurred. But as a working theory or opinion, your REM statement works just fine for me! And I hold your other interpretive statements in similar positive regard as well.
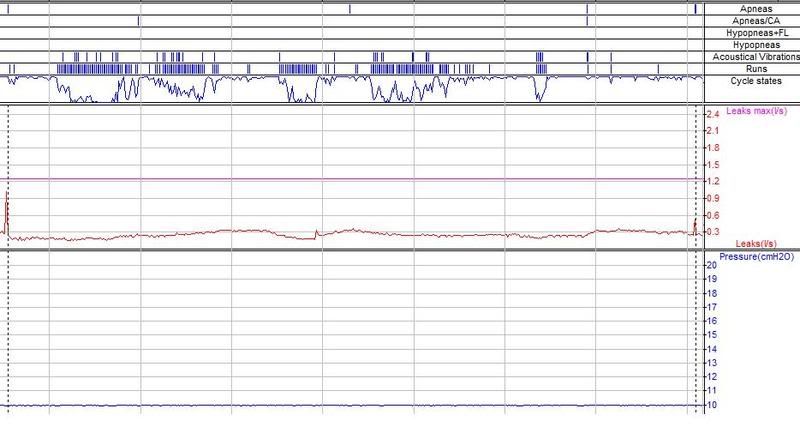


________________________________________________________________

NightHawkeye wrote:
tangents wrote:I respectfully disagree. This data looks much better to me than the chart on page 1 with the wide pressure range. ... I'm happy for you - to me it seems like you've made great progress!
Actually, I agree with you totally, Cathy. Communication is not my strong suit though , so I apologize for clumsy wording on my part. I think the data this morning looks like I may be closing in on the sweet spot, too!

Regards,
Bill
Cathy, thanks for pointing out that first-page chart!

Bill, I hope you're closing in on the sweet spot as well! But you just know we're all going to keep watching for potential calculation bugs, FL flare ups, mask-related measurement patterns, etc. It's that kind of stuff that's keeping us data-weenies riveted to this thread! But it's our hope for your improved health through better therapy that compels many of us to follow your threads in general!


__________________________________________________________________


Ozij, I find all your communications to be wonderfully thought-provoking.... Even if you do make our brains yell "ouch!" from time to time, exactly as Cathy humorously stated!


ozij wrote:I agree with 2 and 3 - not sure if I understand why this has to be a "regression type curve".
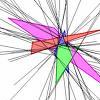
It doesn't have to be a regression type curve. I just glanced at it and thought: "Hey! That sure looks kinda 'regression fitty' to me! But at that point I also suspected the cycle states graph is a best-fit curve among scattered points---with only three possible FL-related data-point values. I still lean toward thinking that...


ozij wrote:
Patent no. 6,488,634 wrote:The determination of the degree of flow limitation present is based on four shape detection parameters, the sinusoidal index, the flatness index, the respiratory effort index and the relative flow magnitude index. The sinusoidal parameter or index is calculated as a correlation coefficient of the actual total inspiratory flow wave (filtered) to a reference sinusoidal half wave. As shown in FIG. 13, a half sinusoidal template 50 that matches the timing and amplitude of the actual total inspiratory flow data is compared to the actual total inspiratory flow data, for example, using a standard Pearson product moment correlation coefficient. This correlation coefficient is an index ranging from 1 (sinusoidal or not flow limited) to 0 (not sinusoidal).
If the actual total inspiratory flow data has less variable breaths, the correlation with a sinusoidal index drops, therefore all breaths will be given a lower sinusoidal index, etc. and there would be more flow limitations.
Well, what you have underlined in the patent description above refers to a correlation coefficient that exists only between: 1) the positive half of a sinusoid template stored in firmware, and 2) the positive or inspiratory half of but one respiratory cycle.

The measured inspiratory half of the cycle is comprised of sampled points that are statistically compared for variance against an idealized sinusoid template. That idealized sinusiod template is never anything other than a sinusoid---regardless of what Bill sets his pressure range to be. But the exact sinusoid used for comparison varies according to highly basic comparison parameters such as period, amplitude, volume. But here we always have one of many perfect sinusoid halves to compare against using Pearson.

And the other half of our covariance comparison is the single measured inspiratory phase, which is Pearson sample-point compared against something that is always an idealized sinusoid half. But so far we're determining only probability index, P1. And we haven't even factored in other breaths. The Pearson coefficient exists only between a single measured breath and a single sinusoid template that is always a sinusoid.

Since this part of the calculation is independent of other breaths, and since the comparison template is always a sinusoid, I don't think the resulting Pearson correlation coefficient stands the potential to be impacted in any way by previous breaths that are not deemed sinusoidal.

There's plenty of potential for software bug in the overall probability equation, but I don't see how the Pearson calculation of P1 is impacted by previous breaths.


And I think you nicely pointed out yet a different part of the equation showing just that potential:
ozij wrote:
Patent no. 6,488,634 wrote:FIG. 16 shows the prior probability factor which is applied to the initial value of the flow limitation parameter calculated from the shape parameters to yield a final value for the current valid breath. The prior probability factors are used to modify the flow limitation parameter based on previous breath's value for flow limitation. The underlined value is an estimate of the best value to be used as a multiplicative or additive to the index. Thus, the flow limitation parameter is made more important when other flow limited breaths have been detected. Similarly, the index is made less "flow limited" if the present occurrence is an isolated incident.

If the flow limitation parameter is between 1 and a predetermined normal reference value, e.g., 0.65-0.8, then the breath is classified as "normal." If the flow limitation parameter is between 0 and a predetermined flow limited reference value, e.g., 0.4, then the breath is classified as "flow limited." If the flow limitation parameter is between the normal and flow limited reference values, then the breath is classified as "intermediate."
By definition, we get a (calculated, albeit not valid) flow limitation cascade.
One of my initial thoughts as well. And I still suspect this part of the equation stands potential to be problematic.

However, we have that first semi-final probability calculation based on index 1 through index four. I'll call that Psub versus the probability calculation we finally end up with after index five steps in with it's temporal or context weighting. I'll just call that last one Pfinal for the sake of discussion.

If what you have underlined in red above uses previous Pfinal values in its calculations (as opposed to using Psub), then we have a massive potential for cascade IMO. I would expect this type of data-return cascade to be even more rampant than what we see in this thread. On the other hand maybe this is exactly what we're seeing on these data charts! Or maybe we're seeing epidemiologically skewed B-coefficient weightings that render final probabilities incorrect under certain index combinations. Perhaps we're seeing the accumulative skew of three or four indexes, each barely leaning toward FL-positive---when the overall inspiratory curve is not quite problematic or even genuinely FL (Bill, a problematic unidirectional-leaning of multiple parameters, very similar to "tolerance stacking" issues in engineering).

If, on the other hand, index five employs previous Psub values in its temporal or context comparison weighting (as opposed to relying on previous Pfinal values), then I think we see a much more potentially viable method of weeding out the likes of isolated signal noise and measurement artifacts.