


I thought it would be useful to start a thread to collect tips for newbies such as myself about how to go about systematically interpreting the sleep data/graphs from machines, particulary the info in Sleepyhead
i.e. specifically what info do you look at (e.g. which graphs or data) in what order and what specifically are you looking for, and how to you link it in with the other graphs
I'll start an example and hopefully other can chime in to correct me so that we end up with a useful summary
After getting my CPAP data from the SD card imported to Sleepyhead, then importing the oximetry data from a pulse oximeter, (then eventually Zeo data) this is what i do (my knowledge is very basic so probably not optimal, hence the purpose of this thread) in Sleepyhead:
1. look at the Daily tab > then click the details tab on right hand window pane to see the AHI (I have preferences set to ignore data sessions under 35 minutes so that my initial 30 mins in bed is not counted in my CPAP data thus giving me a more accurate view of my data during sleep as opposed to when awake trying to sleep - if i am awake after 20-30minutes I will turn the CPAP machine off then on to reset the data recording in sleepyhead)
2. If the AHI is under 4 or so I am pleased, but if higher I consider it a bad night - I think theres some placebo effect here - sometimes I'm not sure if i had a good or bad night upon waking - if i see a v.low AHI I think i must have had a good night and feel more energised (that’s where the placebo effect is sometimes kicking in i think)
- look at the flow rate chart to identify blank spaces which indicates breaks in the data when the machine was turned off e.g when i got up to go to toilet or woke up and turned the machine off (I try to remember to turn the machine off when i wake up so that it will show up on the graph the next day)
3. review the event breakdown pie-chart to see the proportion of central vs obstructive events: I like to see mainly obstructive events as these respond better to treatment
4. click the events tab in the right column and expand the clear airway apnea and obstructive apnea events: assess number of events and the duration of events
5. correlate this by viewing the events flag graph to get an overview of the number and distribution of events throughout the night
- highlight the longest event in the right han events tab on the assumption it is the most damaging
6. correlate each event on the event flag chart with the flow rate chart: there should be flattening of the flow rate waveform corresponding to each event
- try to correlate each event with oximetry SpO2 and pulse rate graphs (ifyou have imported them from your pulse oximeter)
- if its a long event e.g >20s you often will see a drop in oxygen saturation on the SpO2 graphy, usually delayed by a 10-30 seconds after the start of the event
- a drop in O2 may be correlated with an increase in the pulse rate starting a few seconds after the O2 drops
7. check the pressure graph: it isually shows a rise in pressure soon after the start of an obstructive event due to the CPAP machine increasing the pressure to overcome the airway obstruction
8. look at the leak graph and try to correlate large leaks e.g. >16 with events
- a large leak might reduce pressure to the airway and allow an obstructive event to occur so large leaks often precede an obstructive event
9. Respiratory rate: I guess you would expect to see the respiratory rate drop whenever an event occurs and maybe get a compensatory increase when the event is over to increase oxygenation but I havent really noticed a compensatory increase after each event? The respiratory rate graphs seems to correlate quite well woth the Sp02 data though
- periods of active breathing (increased volume and respiratory rate) may correlate (very roughly) with REM sleep
Miscellaneous:
- Sleepyhead alows you to change the order of the graphs presented by dragging them into position. I have my graphs set p in the following order from top to bottom: events flags, flow rate, SpO2, Pulse rate, flow limitation, pressure, leak, snore etc)
- not sure what to make of the mask pressure - it seems to correlate quite well with the flow rate data so not sure if it adds any additional useful info?
- not sure how to interpret the respiratory rate, tidal volume and minute volume, flow limitation, insp time or exp time graphs yet - will look into it later if nobody else can provide insights
will continue this later.....
How to systematically interpret Sleepyhead data - summary?


11 posts
• Page 1 of 1
-
DougalMcDougal
- Posts: 75
- Joined: Wed Nov 14, 2012 4:44 am
How to systematically interpret Sleepyhead data - summary?
_________________
| Humidifier: S9™ Series H5i™ Heated Humidifier with Climate Control |
| Additional Comments: Resmed Quattro FX full face, CMS 50F oximeter, Glo to Sleep Mask, Zeo Pro+, Tempurpedic Cloud bed |
Last edited by DougalMcDougal on Sat Dec 15, 2012 4:07 pm, edited 5 times in total.

Re: How to systematically interpret Sleepyhead data - summary?
IMO, it would be a waste to deal with SleepyHead for users of Resmed machines. OK, it's faster than ResScan but it's full of bugs.
The ResScan Stats without the graphs provide lots of information about the treatment. Once you post graphs then multiple posters take guesses which are often confusing to the OP.
The ResScan Stats without the graphs provide lots of information about the treatment. Once you post graphs then multiple posters take guesses which are often confusing to the OP.
_________________
| Mask: Mirage™ SoftGel Nasal CPAP Mask with Headgear |
| Humidifier: S9™ Series H5i™ Heated Humidifier with Climate Control |
| Additional Comments: S9 Autoset machine; Ruby chinstrap under the mask straps; ResScan 5.6 |
Last edited by avi123 on Sat Dec 08, 2012 6:38 pm, edited 4 times in total.
see my recent set-up and Statistics:
http://i.imgur.com/TewT8G9.png
see my recent ResScan treatment results:
http://i.imgur.com/3oia0EY.png
http://i.imgur.com/QEjvlVY.png
http://i.imgur.com/TewT8G9.png
see my recent ResScan treatment results:
http://i.imgur.com/3oia0EY.png
http://i.imgur.com/QEjvlVY.png
Re: How to systematically interpret Sleepyhead data - summary?
I think this could be a very useful thread. I don't think it matters if the data is presented in SH or RS. It's learning to understand what he data is saying and to compare the graphs to each other and draw some conclusions.
_________________
| Machine: AirCurve™ 10 VAuto BiLevel Machine with HumidAir™ Heated Humidifier |
| Mask: Brevida™ Nasal Pillow CPAP Mask with Headgear |
| Humidifier: S9™ Series H5i™ Heated Humidifier with Climate Control |
| Additional Comments: S9 VPAP Auto Bilevel Machine |
Re: How to systematically interpret Sleepyhead data - summary?
Personal preferences. I like that I can determine which graphs show up on the screen and in which order. The data makes perfect sense when I set it up for what I want and fits on one screen. Alright! My data matches up very well between SleepyHead and ResScan. JME.avi123 wrote:IMO, it would be a waste to deal with SleepyHead for users of Resmed machines. OK, it's faster than ResScan but it's full of bugs.
_________________
| Machine: AirSense™ 10 CPAP Machine with HumidAir™ Heated Humidifier |
| Mask: Mirage Quattro™ Full Face CPAP Mask with Headgear |
| Additional Comments: Apap 16 to 18 |

Re: How to systematically interpret Sleepyhead data - summary?
A large number of people with ResMed machines and both SleepyHead and ResScan disagree.avi123 wrote:IMO, it would be a waste to deal with SleepyHead for users of Resmed machines. OK, it's faster than ResScan but it's full of bugs.
_________________
| Mask: Swift™ FX Nasal Pillow CPAP Mask with Headgear |
| Humidifier: S9™ Series H5i™ Heated Humidifier with Climate Control |
| Additional Comments: Also SleepyHead, PRS1 Auto, Respironics Auto M series, Legacy Auto, and Legacy Plus |
Please enter your equipment in your profile so we can help you.
Click here for information on the most common alternative to CPAP.
If it's midnight and a DME tells you it's dark outside, go and check for yourself.
Useful Links.
Click here for information on the most common alternative to CPAP.
If it's midnight and a DME tells you it's dark outside, go and check for yourself.
Useful Links.
-
Lizistired
- Posts: 2835
- Joined: Tue Dec 14, 2010 10:47 pm
- Location: Indiana
Re: How to systematically interpret Sleepyhead data - summary?
Not sure what you mean. Both programs will do that. ResScan gives you a little more control over the ranges.MyIdaho wrote:Personal preferences. I like that I can determine which graphs show up on the screen and in which order...
_________________
| Mask: Swift™ LT Nasal Pillow CPAP Mask with Headgear |
| Humidifier: S9™ Series H5i™ Heated Humidifier with Climate Control |
| Additional Comments: Swift FX sometimes, CMS-50F, Cervical collar sometimes, White noise, Zeo... I'm not well, but I'm better. |
ResScan: http://www.resmed.com/int/assets/html/s ... c=patients
ResScan Tutorial- http://montfordhouse.com/cpap/resscan_tutorial/
Machines Video: http://www.cpaplibrary.com/machine-education
ResScan Tutorial- http://montfordhouse.com/cpap/resscan_tutorial/
Machines Video: http://www.cpaplibrary.com/machine-education
-
Denial Dave

- Posts: 1335
- Joined: Wed Sep 19, 2012 6:45 am
- Location: Connecticut
Re: How to systematically interpret Sleepyhead data - summary?
I primarily use Sleepyhead because I can get it running, upload data & view it long before Rescan finishes opening up.
Rescan software & the data is great, but it is bloated with all kinds of monitoring "crapola" that I will never use or need.
Give me "Rescan user edition or Rescan lite" and I'll consider leaving Sleepyhead.
Rescan software & the data is great, but it is bloated with all kinds of monitoring "crapola" that I will never use or need.
Give me "Rescan user edition or Rescan lite" and I'll consider leaving Sleepyhead.
_________________
| Mask: Mirage Quattro™ Full Face CPAP Mask with Headgear |
| Humidifier: S9™ Series H5i™ Heated Humidifier with Climate Control |
| Additional Comments: Started at VPAP pressure setting of 20/14.4. I've survived Stage 1 cancer and lost 80+ lbs. Pressure is now 14.5 / 11 |
if you don't know where you are going... any road will take you there.... George Harrison
-
DougalMcDougal
- Posts: 75
- Joined: Wed Nov 14, 2012 4:44 am
Re: How to systematically interpret Sleepyhead data - summary?
updated the interpretation info in the first post
_________________
| Humidifier: S9™ Series H5i™ Heated Humidifier with Climate Control |
| Additional Comments: Resmed Quattro FX full face, CMS 50F oximeter, Glo to Sleep Mask, Zeo Pro+, Tempurpedic Cloud bed |
-
wildflowertx

- Posts: 98
- Joined: Wed Nov 07, 2012 1:17 am
- Location: North Texas
Re: How to systematically interpret Sleepyhead data - summary?
I appreciate your starting this thread, Dougal. Like you, I'd like to be able to interpret what I'm seeing in Sleepyhead...but too many of the graphs give no explanation/hint for what they ARE for us newbies, and it's hard to find that info anywhere. I haven't read every single "please interpret my data" thread (perhaps I should), but most of those I've seen have generally involved the old hands essentially saying whether the numbers are good, without saying what they MEAN. No offense to the old hands, we newbies obviously appreciate the willingness to provide answers, but I think sometimes y'all forget that a lot of this stuff you kind of take for granted now, and we don't understand what you're actually saying right off the bat...
For instance, as with Dougal, I'd love to know what this stuff means:
"- not sure how to interpret the respiratory rate, tidal volume and minute volume, flow limitation, insp time or exp time graphs yet - will look into it later if nobody else can provide insights"
For instance, as with Dougal, I'd love to know what this stuff means:
"- not sure how to interpret the respiratory rate, tidal volume and minute volume, flow limitation, insp time or exp time graphs yet - will look into it later if nobody else can provide insights"
_________________
| Mask: SleepWeaver Elan™ Soft Cloth Nasal CPAP Mask - Starter Kit |
| Humidifier: S9™ Series H5i™ Heated Humidifier with Climate Control |
| Additional Comments: Heated hose; CMS-50F pulse oximeter; Zeo Bedside Sleep Manager; also Swift FX For Her mask |
Steph
Treatment started 11/27/12
Treatment started 11/27/12

Re: How to systematically interpret Sleepyhead data - summary?
What I would like to see is someones come alongside the creator of SleepyHead and work to find a much, much, much less complicated user interface. One or two graphs. A summery page of the important stuff.DougalMcDougal wrote:I thought it would be useful to start a thread to collect tips for newbies such as myself about how to go about systematically interpreting the sleep data/graphs from machines, particulary the info in Sleepyhead.....
will continue this later.....
I do not mean take anything out of SleepyHead - leave everything in there.
I am a technical guy who loves technical challenges. From what I can tell we copmprise about 5% of the population.
We need to make this for everybody. We need to find a simple solution everyone can use.
FWIW
Todzo
May any shills trolls sockpuppets or astroturfers at cpaptalk.com be like chaff before the wind!

Re: How to systematically interpret Sleepyhead data - summary?
There is a SleepyHead Glossary...link is in my signature. It's mainly definitions that were pulled from Respironics and Resmed clinical manuals. So first step in understanding what a person sees on their reports is becoming familiar with the definition itself. People want to be able to understand where their values relate in terms of what is "normal" and for that people need to google some of the terms and read up on what is the normal range. Tidal volume and minute volume both have a wide range of what is normal. They vary with sex, height, and even altitude where a person lives.I'd love to know what this stuff means:
"- not sure how to interpret the respiratory rate, tidal volume and minute volume, flow limitation, insp time or exp time graphs
To be honest...I don't even pay attention to these values.
Respiratory rate...again wide range of norms and it is also normal to have the rate vary during sleep time. Have a good dream and the respiratory rate will likely increase a bit.
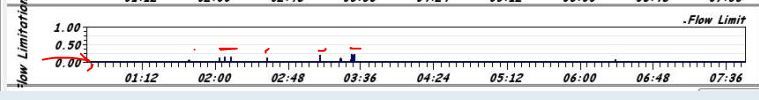
Flow limitation graph...ResMed machine feature only. Hard to evaluate. I will poke around to see if I can get some examples that will help clarify what to look at. Mainly its a general quick look to see if the graph is fairly active...if it is there are some flow limitations going on that may or may not end up with flagged events.
My own flow limitation graphs are consistently pretty much boring..
I have never really bothered with insp or exp time. Other than being a number I don't know their significance relating to therapy.
Putting these graphs under the microscope seems to be what a lot of people want to do. In all honesty it is more work than I normally want to do. Most of it is just normal variances anyway and unless someone has lung issues (which they would probably already know about) I don't see them being hugely helpful in evaluation of my therapy.
Snore graphs or flow limitation graphs can be useful along with the flow graphs, leak graphs and pressure graphs (when using auto adjusting pressures) but the other graphs aren't all that important to me.
I have a couple of PDFs from ResScan and ResMed that may explain a little better what the various values might mean and I will see if I can find additional information to help clarify what is offered. Remember these values are really designed to be reviewed by medical professionals and ResMed treats these values as something the medical professional would already understand and doesn't see a need to explain to a doctor what such and such points to.
I haven't spent much time reading those PDFs...I will try to do that later this afternoon after hubby goes to work.
_________________
| Machine: AirCurve™ 10 VAuto BiLevel Machine with HumidAir™ Heated Humidifier |
| Additional Comments: Mask Bleep Eclipse https://bleepsleep.com/the-eclipse/ |
I may have to RISE but I refuse to SHINE.
If you want to try the Eclipse mask and want a special promo code to get a little off the price...send me a private message.
If you want to try the Eclipse mask and want a special promo code to get a little off the price...send me a private message.
11 posts
• Page 1 of 1