Factors I have been measuring include:
1) Tongue (GG) muscle activity
2) Diaphragm muscle activity
3) Diaphragm position
4) Changes in thoracic and abdominal compartmental volumes
5) when does the airway collapse? i.e. at the end of expiration (passive collapse) or during inspiration (active collapse).
Here is a snap shot of some of the data in a patient I had in the other night.
Here's what everything stands for:
EMGgg = electrical activity of the genioglossus (tongue)
EMGdi = electrical activity of the diaphragm (measured by an oesophageal catheter)
Pmask = mask pressure
Pepi = epiglottic pressure
Poes = oesophageal pressure
Pga = gastric pressure
Sats = oxygen saturations

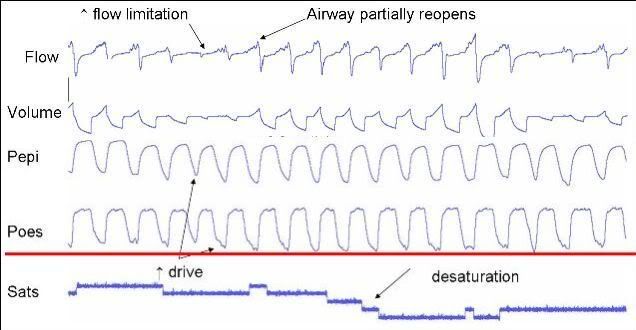
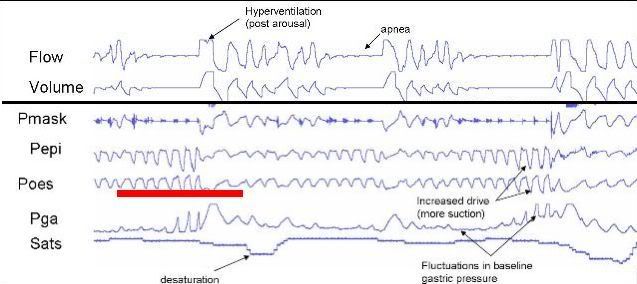
So, as you can see, there is a pretty obvious decrease in GG activity just prior to an apnea and particularly during the apnea. Oesophageal and epiglottic pressure becomes more negative during respiratory attempts, indicating increased respiratory "drive." However, this drive does not seem to occur in respect to the GG. At the same time, baseline gastric pressure increases, likely indicating contraction of the abdominal muscles. These contractions are thought to help with diaphragmatic contractions, but perhaps to try and increase pressure inside the airway to "pop" open the airway.
You can see the subsequent hyperventilation period at the end of termination, again indicating the increased drive. While I did not show it, end tidal CO2 levels decrease during this hyperventilation. The patient may blow off so much CO2 that the begin to hypovenilate because their CO2 dips below their "breathing threshold." This period of low CO2 results in the dilator muscles being switched off. Obviously this leaves the airway vulnerable to collapse during the next inspiratory effort.
Now, at the same time, I have been measuring changes in anterior-posterior (front-back) dimensions of the chest and abdomen to evaluate alterations in thoracic and abdominal compartmental volumes. Here's a very rough diagragm showing these changes.

Now, the respiratory flow is not shown as the lung volume stuff was recorded on another computer. We will try to incorporate this data later.
The first trace = anterio-posterior distance of the chest
Second trace = lateral dimensions of the chest
Third trace = anterio-posterior distance of the abdomen
Fouth trace = lateral dimensions of the abdomen
It's just easier to focus on the anterio-posterior traces. Sorry, I don't have any numbers on the picture.
Now, I don't know where the apneas are at this stage but I would bet there would be about six in there. You can clearly see the decrease in A-P dimensions of both the chest and abdomen (~2-4mm). Now, that might not sound a lot but these kind of numbers might represent a fall in lung volume of about ~200-400mL.
Just looking at abdomen changes in A-P. The abdomen is basically an incompressible structure (unlike the chest). In other words, you cannot change the overall "total" dimensions of the abdomen (for a given volume) i.e. a decrease in A-P distance would likely result in an increase in the lateral dimensions. Alternatively, the diaphragm may ascend, allowing the abdominal contents to enter the chest --> further reducing lung volume.
Therefore, as you can see in the picture, A-P dimensions of the abdomen decrease (there are changes in lateral distances). Depending on our analysis, this may suggest that the diaphragm is moving up into the chest.
Interesting times ahead...