how to interpret Flow Limitation graphs

General Discussion on any topic relating to CPAP and/or Sleep Apnea.
User avatar
NotMuffy
Posts: 962
Joined: Wed Sep 16, 2009 6:56 am
Location: Dunno. GPS is dead.

Re: how to interpret Flow Limitation graphs

Post by NotMuffy » Tue Mar 08, 2011 7:41 pm

robysue wrote:Normal PSGs don't measure:

*Esophageal pressure (not unless there's a balloon down your throat---that's part of why many labs don't try to score RERAs)
Whoa, they all can, should, and always should have (scored RERAs).

The key component of the RERA is the arousal, and arousal criteria have never changed. So even before RERAs were invented, if you had a bunch of arousals that disappeared with xPAP, they were probably respiratory-related.

The current RERA definition says all you need is a pressure transducer and/or a couple of RIP belts:

Image
"Don't Blame Me...You Took the Red Pill..."

User avatar
NotMuffy
Posts: 962
Joined: Wed Sep 16, 2009 6:56 am
Location: Dunno. GPS is dead.

Re: how to interpret Flow Limitation graphs

Post by NotMuffy » Tue Mar 08, 2011 8:14 pm

robysue wrote:To muddy the waters much further, any idea on how "bad" or how "long" the changes in the inspiratory part of the flow has to be before the PR System One decides to flag something as a "flow limitation" in Encore Viewer? I ask because the tick marks for "flow limitation" in Encore have never made any sense to me since I started out looking at continuous flow limitation graphs on the S9. And it was easy to correlate the "low" spots in ResScan 3.11 (where the FLAT Closed airway symbol was on the bottom of the graph) to, shall we say, stranger, less rounded inspiratory parts of the flow data itself. Since I never remember dropping below the "half-way" point between the "Open" rounded hump symbol and the "Closed" flat line symbol, I never worried too much about this. Although I did note that when I had flow limitations that corresponded to 75% of the way to "OPEN", that lasted any length of time (say 5--10 minutes or more), the S9 would increase pressure when in APAP mode.

And now on the PR S1 BiPAP, I've yet to see anything tagged as a "Flow Limitation" in Encore Viewer's detailed data. That's 2 1/2 months worth of FL index 0.0 and no tick marks on the Flow Limitation line. Haven't looked at anywhere near as much flow data since that requires an extra step now. But on bad nights, I do download the data into Encore Pro (on a different machine). And see some inspirations that look similar to ones that I used to see in ResScan's flow data during periods where the Flow Limitation curve was moving from the Open end towards the half-way to Closed part of the y-axis (and the S9 Auto algorithm frequently deciding to increase pressure). So I can't help but wonder: How ragged does the inspiration part of the flow data have to get (both in terms of shape and length of time) before the S1 scores it as a Flow Limitation?
I believe your data is in keeping with the approach to FL in those manufacturers' algorithms as demonstrated in the McCoy bench testing, which showed ResMed as having a very aggressive approach to FLs:

Image
"Don't Blame Me...You Took the Red Pill..."

Janknitz
Posts: 8503
Joined: Sat Mar 20, 2010 1:05 pm
Location: Northern California

Re: how to interpret Flow Limitation graphs

Post by Janknitz » Tue Mar 08, 2011 8:30 pm

RobySue wrote:
And now on the PR S1 BiPAP, I've yet to see anything tagged as a "Flow Limitation" in Encore Viewer's detailed data.
I have tons of yellow tickmarks for flow limitations, but they don't seem to correlate to anything at all. I also have a high number of vibratory snores.

The oddest thing is that fact that I have low VS and FL at the low end of my pressure range (9 to 11 cm) then they both seem to increase in the middle of my pressure range (around 11 to 13 cm) and then decrease again at higher pressures (13 to 15). It's very weird.

Since I have otherwise very good numbers and results, it's just an interesting tidbit but nothing I get too excited about since there seems to be no satisfactory explanation for this.
What you need to know before you meet your DME http://tinyurl.com/2arffqx
Taming the Mirage Quattro http://tinyurl.com/2ft3lh8
Swift FX Fitting Guide http://tinyurl.com/22ur9ts
Don't Pay that Upcharge! http://tinyurl.com/2ck48rm

User avatar
SleepingUgly
Posts: 4690
Joined: Sat Nov 28, 2009 9:32 pm

Re: how to interpret Flow Limitation graphs

Post by SleepingUgly » Tue Mar 08, 2011 8:50 pm

NotMuffy wrote:Whoa, they all can, should, and always should have (scored RERAs).

The key component of the RERA is the arousal, and arousal criteria have never changed. So even before RERAs were invented, if you had a bunch of arousals that disappeared with xPAP, they were probably respiratory-related.

The current RERA definition says all you need is a pressure transducer and/or a couple of RIP belts
My doc doesn't score RERAs because he says that the scoring of arousals is not standardized between technicians, and when you add to that different definitions of FLs, it becomes even more of a problem and is too subjective. Is that wrong?
Never put your fate entirely in the hands of someone who cares less about it than you do. --Sleeping Ugly

User avatar
avi123
Posts: 4509
Joined: Tue Dec 21, 2010 5:39 pm
Location: NC

Re: how to interpret Flow Limitation graphs

Post by avi123 » Tue Mar 08, 2011 8:50 pm

need to re-edit

_________________
Humidifier: S9™ Series H5i™ Heated Humidifier with Climate Control
Additional Comments:  S9 Autoset machine; Ruby chinstrap under the mask straps; ResScan 5.6
Last edited by avi123 on Wed Mar 09, 2011 1:03 am, edited 5 times in total.
see my recent set-up and Statistics:
http://i.imgur.com/TewT8G9.png
see my recent ResScan treatment results:
http://i.imgur.com/3oia0EY.png
http://i.imgur.com/QEjvlVY.png

User avatar
ozij
Posts: 10444
Joined: Fri Mar 18, 2005 11:52 pm

Re: how to interpret Flow Limitation graphs

Post by ozij » Tue Mar 08, 2011 8:54 pm

Your pressure increases in response to the snores and flow limitations.
It will be low only when you have none, and keep rising till they disappear. Which is why you'll see most of them midway between "no obstructions, pressure can be low" and "pressure is finally high enough to keep you from obstructing in whatever condition does cause the obstruction".
It's the obstruction level driving the pressure change, not vice versa.

_________________
Mask: AirFit™ P10 Nasal Pillow CPAP Mask with Headgear
Additional Comments: Machine: Resmed AirSense10 for Her with Climateline heated hose ; alternating masks.
And now here is my secret, a very simple secret; it is only with the heart that one can see rightly, what is essential is invisible to the eye.
Antoine de Saint-Exupery

Good advice is compromised by missing data
Forum member Dog Slobber Nov. 2023

User avatar
idamtnboy
Posts: 2186
Joined: Mon Nov 01, 2010 2:12 pm
Location: Idaho

Re: how to interpret Flow Limitation graphs

Post by idamtnboy » Tue Mar 08, 2011 9:29 pm

christinepi wrote:I finally found the Flow Limitation graph with the help of many friendly posters, and now I'd love some help with interpreting it.
Hey christinepi, after reading all these comments had any second thoughts about asking that question in the first place??? Kind of like asking, "From the stand point of enhancing one's life experiences what's the best way to travel from San Francisco to New York?", isn't it??

_________________
Mask: AirFit™ P10 Nasal Pillow CPAP Mask with Headgear
Humidifier: S9™ Series H5i™ Heated Humidifier with Climate Control
Additional Comments: Hose management - rubber band tied to casement window crank handle! Hey, it works! S/W is 3.13, not 3.7

jnk
Posts: 5784
Joined: Mon Jun 30, 2008 3:03 pm

Re: how to interpret Flow Limitation graphs

Post by jnk » Tue Mar 08, 2011 9:50 pm

idamtnboy wrote:
christinepi wrote:I finally found the Flow Limitation graph with the help of many friendly posters, and now I'd love some help with interpreting it.
Hey christinepi, after reading all these comments had any second thoughts about asking that question in the first place??? Kind of like asking, "From the stand point of enhancing one's life experiences what's the best way to travel from San Francisco to New York?", isn't it??
I, for one, am very glad the question was asked the way that it was, since the following gem from -SWS answered the question perfectly, in my opinion:
-SWS wrote:"[The flow limitation graph] is obviously not a purely empirical graph and microanalysis is not suitable for that graph IMO. I think that . . . graph is best employed for purposes of trending and heuristically/visually comparing pre-interpreted FL severity from one night to the next."
Answers don't get more succinctly precise than that, and it manages to highlight both the usefulness of the graph and the limitations of it at the same time.

Answers like that are much of the reason I can't seem to stay away from this place.

User avatar
NotMuffy
Posts: 962
Joined: Wed Sep 16, 2009 6:56 am
Location: Dunno. GPS is dead.

Re: how to interpret Flow Limitation graphs

Post by NotMuffy » Wed Mar 09, 2011 4:07 am

idamtnboy wrote:
christinepi wrote:I finally found the Flow Limitation graph with the help of many friendly posters, and now I'd love some help with interpreting it.
Hey christinepi, after reading all these comments had any second thoughts about asking that question in the first place??? Kind of like asking, "From the stand point of enhancing one's life experiences what's the best way to travel from San Francisco to New York?", isn't it??
LOL! Probably not as many second thoughts as this response:
idamtnboy wrote:The smart ass answer is, "Good luck, 'cause you ain't gonna get any help!" The real answer, unfortunately, is much the same except in nicer words.

There are no good explanations what FL really means. It was discussed in this thread, viewtopic/t61287/viewtopic.php?f=1&t=60 ... on#p571528. Go to page 12 of the thread if the link doesn't take you directly there. In short the FL degree is an indicator, and apparently not a measure, of how much the upper airway passage is closed down and thus restricting, or limiting, the air flow. As to what the cause is, and what the impact is, apparently is quite elusive and no one really knows. That's why there are symbols and not numbers on the Y axis.
BTW, there are, in fact, not only numerical values associated with the "Y-axis", but the range is configurable as well.
"Don't Blame Me...You Took the Red Pill..."

User avatar
NotMuffy
Posts: 962
Joined: Wed Sep 16, 2009 6:56 am
Location: Dunno. GPS is dead.

Re: how to interpret Flow Limitation graphs

Post by NotMuffy » Wed Mar 09, 2011 5:15 am

SleepingUgly wrote:
NotMuffy wrote:Whoa, they all can, should, and always should have (scored RERAs).

The key component of the RERA is the arousal, and arousal criteria have never changed. So even before RERAs were invented, if you had a bunch of arousals that disappeared with xPAP, they were probably respiratory-related.

The current RERA definition says all you need is a pressure transducer and/or a couple of RIP belts
My doc doesn't score RERAs because he says that the scoring of arousals is not standardized between technicians, and when you add to that different definitions of FLs, it becomes even more of a problem and is too subjective. Is that wrong?
If there are inconsistencies with the technicians (BTW, everybody should be scoring interreliably at no less than 85%) and the physician's solution is to ignore it, then I would say the problem is insurmountable.
"Don't Blame Me...You Took the Red Pill..."

User avatar
NotMuffy
Posts: 962
Joined: Wed Sep 16, 2009 6:56 am
Location: Dunno. GPS is dead.

You Want "Exactly"?

Post by NotMuffy » Thu Mar 10, 2011 6:26 am

In attempting to understand the concept of Flow Limitation (FL), and the new ResMed measure, Fuzzy Flow Limitation (FFL), I believe it is important to review some of the components in the document presented by LoQ (op. cit.). In that document, it appears that FFL is actually composed of at least 3 measures:

Wave Form Shape (with accent on "M" and "Chair" shapes);
Dynamic Tidal Volume, expressed as Ventilation Ratio (VR); and
Inspiratory Time, expressed as a fraction of the duty (entire respiratory) cycle, or Ti-on-Ttot Ratio (TTR).

It is critical to note, however, combinations of these components may either enhance or ameliorate FFL, as noted in the four tables. For instance, no matter how vicious an "M"-shaped waveform is, if VR is high or very high, the algorithm says it's NBD.

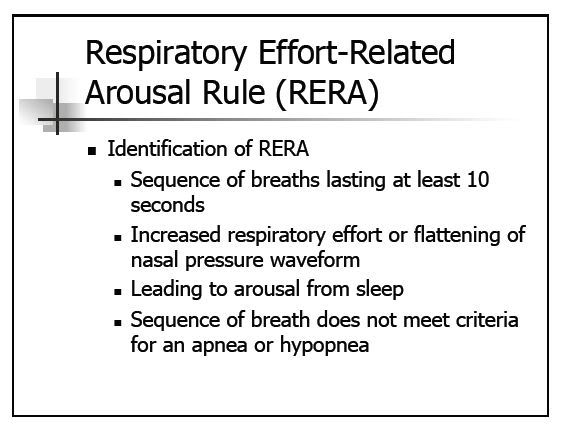
Additionally, snoring, leaks, an extraordinarily long inspiration or expiration, and level of pressure are also accounted for, which, "IMHO" make this algorithm very clever, not only preventing pressure attacks on suspect waveforms, but identifying (indirectly) arousals and attacking RERAs with reasonable accuracy (more later).

So if the FFL isn't simply a measure of "flatness", in order to properly analyze this, we need to look at the aforementioned "number" associated with FFL (you can see this by "mousing over" the waveform, or use the methodology discussed elsewhere to edit ResScan and add Values to the graphs):

Image

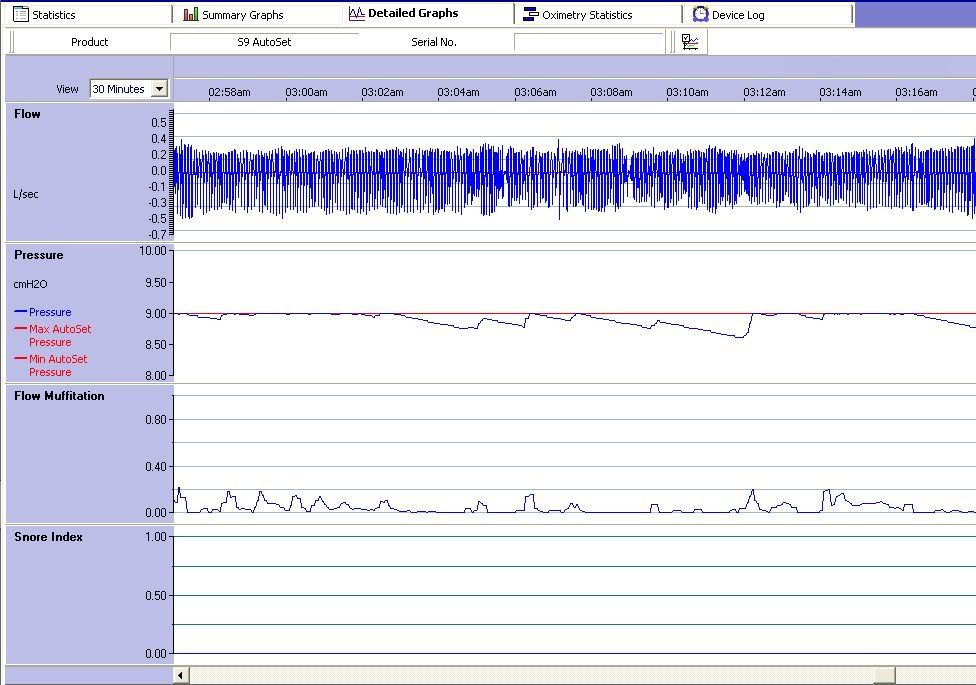
In this version of MuffScan I've also added numerical value to snoring, another discussion point for later.

As noted by gvz, it is extremely important that one make a back-up copy of any config files before you edit them. Make note of the file name, and also be sure it's called something that you'll be able to find later. Otherwise, you will end up in the same boat as Muffy, who labels her files such things as "I'llRememberThis" or "Thursday" or "Important", and stubbornly refuses to believe that she will not, in fact, remember what day it actually is much less what a file called Monday (or Monday(1256). She does that a lot) goes to.

BTW: I think I'll hold off on "fuschia", at least for the first part of this discussion. That might be a little much.

Besides, the Fuschia File was called...

...was called...

...is today Wednesday?
"Don't Blame Me...You Took the Red Pill..."

User avatar
SleepingUgly
Posts: 4690
Joined: Sat Nov 28, 2009 9:32 pm

Re: how to interpret Flow Limitation graphs

Post by SleepingUgly » Thu Mar 10, 2011 7:27 am

NotMuffy wrote:If there are inconsistencies with the technicians (BTW, everybody should be scoring interreliably at no less than 85%) and the physician's solution is to ignore it, then I would say the problem is insurmountable.
Are the scoring criteria for arousals and FLs clearly defined? Is the interrater reliability of your technician's scorings high?
Never put your fate entirely in the hands of someone who cares less about it than you do. --Sleeping Ugly

christinepi
Posts: 75
Joined: Sun Dec 12, 2010 2:18 pm

Re: how to interpret Flow Limitation graphs

Post by christinepi » Thu Mar 10, 2011 9:38 am

idamtnboy wrote:
christinepi wrote:I finally found the Flow Limitation graph with the help of many friendly posters, and now I'd love some help with interpreting it.
Hey christinepi, after reading all these comments had any second thoughts about asking that question in the first place??? Kind of like asking, "From the stand point of enhancing one's life experiences what's the best way to travel from San Francisco to New York?", isn't it??
Well, thanks for asking... my eyes started glazing over pretty quickly, I'll admit. But I'm in awe at the knowledge on this forum. When I talked to my tech at the DME company yesterday and she said that when she talked to a RESMED rep regarding a question I had they told her the most recent RESCAN version was 3.11, it was just one more confirmation that there are two different CPAP universes out there. As if it needed confirmation.

_________________
Mask: Mirage Quattro™ Full Face CPAP Mask with Headgear
Humidifier: S9™ Series H5i™ Heated Humidifier with Climate Control
Additional Comments: Started 12/8/10; IP 14, EP 7

User avatar
idamtnboy
Posts: 2186
Joined: Mon Nov 01, 2010 2:12 pm
Location: Idaho

Re: how to interpret Flow Limitation graphs

Post by idamtnboy » Thu Mar 10, 2011 11:03 pm

christinepi wrote:
idamtnboy wrote:
christinepi wrote:I finally found the Flow Limitation graph with the help of many friendly posters, and now I'd love some help with interpreting it.
Hey christinepi, after reading all these comments had any second thoughts about asking that question in the first place??? Kind of like asking, "From the stand point of enhancing one's life experiences what's the best way to travel from San Francisco to New York?", isn't it??
Well, thanks for asking... my eyes started glazing over pretty quickly, I'll admit. But I'm in awe at the knowledge on this forum.
I agree with you wholeheartedly. As for eyes glazing over that's pretty much why I made the first comment I did. I'm no academic dummy, but not a PhD type either. I'm a lot more into mechanical stuff than medical issues, except I did buy a medical text book on metabolism one time to try to better understand diet and diabetes and actually comprehended some of it! The discussions about Flow Limitation in this thread and earlier ones strike me as a bit like a pretzel, not completely circular, and not completely twisted, but sure comes close to looking like it!

_________________
Mask: AirFit™ P10 Nasal Pillow CPAP Mask with Headgear
Humidifier: S9™ Series H5i™ Heated Humidifier with Climate Control
Additional Comments: Hose management - rubber band tied to casement window crank handle! Hey, it works! S/W is 3.13, not 3.7

User avatar
NotMuffy
Posts: 962
Joined: Wed Sep 16, 2009 6:56 am
Location: Dunno. GPS is dead.

Re: how to interpret Flow Limitation graphs

Post by NotMuffy » Fri Mar 11, 2011 5:37 am

christinepi wrote:Well, thanks for asking... my eyes started glazing over pretty quickly....
Hey, you did say
christinepi wrote:but please try to be as specific as possible....
and this thread pretty much complied with your request.
idamtnboy wrote:As for eyes glazing over that's pretty much why I made the first comment I did.
In reviewing your "first comment(s)", you said
idamtnboy wrote:The smart ass answer is, "Good luck, 'cause you ain't gonna get any help!"
and
idamtnboy wrote:As to what the cause is, and what the impact is, apparently is quite elusive and no one really knows.
which I must respectfully submit were both erroneous, and proven to be so.

christinepi is and will receive more help than she can possibly use (yet this is the nature of forum discussion. Some responses and discussions may be of more interest to some than others), and you shouldn't say "no one knows" if what you really mean is "you don't know".
"Don't Blame Me...You Took the Red Pill..."