


Is there any way in Sleepyhead to have it create a waveform chart for "Time over red line"?
I know the number appears in daily view, but since I personally choose to concentrate on that number a lot in trying to control mask leak, it would be helpful to see it charted in waveform over a number of days, or perhaps even a month, at a single glance.
I haven't figured out a way but hope I am just overlooking something.
Regards, Nate
SleepyHead-Any chart for "Time over red line"?
SleepyHead-Any chart for "Time over red line"?
_________________
| Mask: DreamWear Nasal CPAP Mask with Headgear |
| Additional Comments: ResMed AirCurve 10 ASV; Dreamwear Nasal Mask Original; CPAPMax Pillow; ResScan & SleepyHead |
Central sleep apnea AHI 62.6 pre-VPAP. Now 0 to 1.3
Present Rx: EPAP: 8; IPAPlo:11; IPAPHi: 23; PSMin: 3; PSMax: 15
"I've had a perfectly wonderful evening, but this wasn't it." —Groucho Marx
Present Rx: EPAP: 8; IPAPlo:11; IPAPHi: 23; PSMin: 3; PSMax: 15
"I've had a perfectly wonderful evening, but this wasn't it." —Groucho Marx

Re: SleepyHead-Any chart for "Time over red line"?
nope, sorry.NateS wrote:Is there any way in Sleepyhead to have it create a waveform chart for "Time over red line"?
Get OSCAR
Accounts to put on the foe list: dataq1, clownbell, gearchange, lynninnj, mper!?, DreamDiver, Geer1, almostadoctor, sleepgeek, ajack, stom, mogy, D.H., They often post misleading, timewasting stuff.
Accounts to put on the foe list: dataq1, clownbell, gearchange, lynninnj, mper!?, DreamDiver, Geer1, almostadoctor, sleepgeek, ajack, stom, mogy, D.H., They often post misleading, timewasting stuff.
Re: SleepyHead-Any chart for "Time over red line"?
Thanks for your quick and frank reply, PR!palerider wrote:nope, sorry.NateS wrote:Is there any way in Sleepyhead to have it create a waveform chart for "Time over red line"?
Boohoo!
Well, here's a followup thought - is there anyway to export the "Time over red line" numbers out of Sleepyhead so as to import them into Excel to create a waveform chart?
Regards, Nate
_________________
| Mask: DreamWear Nasal CPAP Mask with Headgear |
| Additional Comments: ResMed AirCurve 10 ASV; Dreamwear Nasal Mask Original; CPAPMax Pillow; ResScan & SleepyHead |
Central sleep apnea AHI 62.6 pre-VPAP. Now 0 to 1.3
Present Rx: EPAP: 8; IPAPlo:11; IPAPHi: 23; PSMin: 3; PSMax: 15
"I've had a perfectly wonderful evening, but this wasn't it." —Groucho Marx
Present Rx: EPAP: 8; IPAPlo:11; IPAPHi: 23; PSMin: 3; PSMax: 15
"I've had a perfectly wonderful evening, but this wasn't it." —Groucho Marx
Re: SleepyHead-Any chart for "Time over red line"?
you can try a csv export, maybe that info is in there. I never do the csv thing, so I don't know what daily numbers are in there... sorry.NateS wrote:Well, here's a followup thought - is there anyway to export the "Time over red line" numbers out of Sleepyhead so as to import them into Excel to create a waveform chart?
Get OSCAR
Accounts to put on the foe list: dataq1, clownbell, gearchange, lynninnj, mper!?, DreamDiver, Geer1, almostadoctor, sleepgeek, ajack, stom, mogy, D.H., They often post misleading, timewasting stuff.
Accounts to put on the foe list: dataq1, clownbell, gearchange, lynninnj, mper!?, DreamDiver, Geer1, almostadoctor, sleepgeek, ajack, stom, mogy, D.H., They often post misleading, timewasting stuff.

Re: SleepyHead-Any chart for "Time over red line"?
I read the length of time above the red line from the ResScan chart.
All are ResScan:
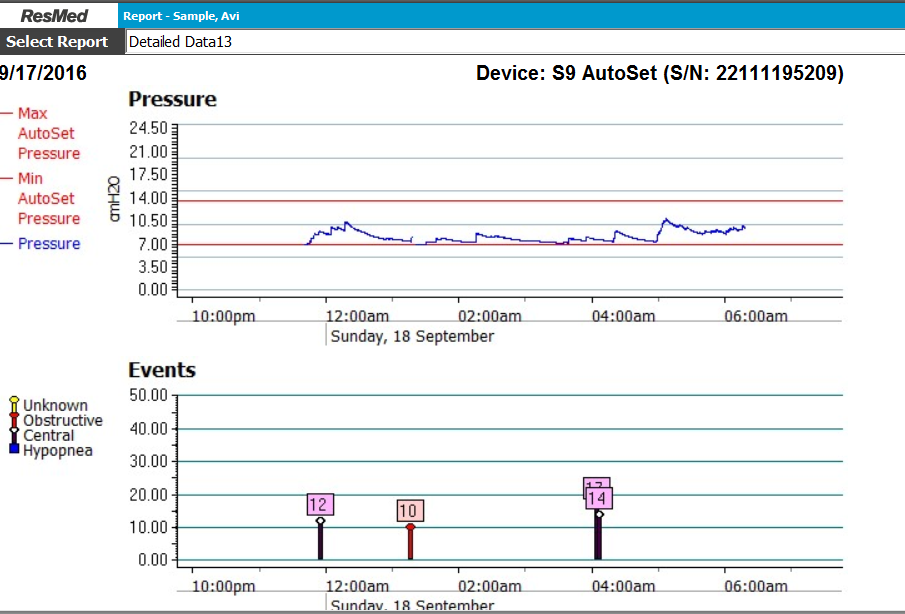
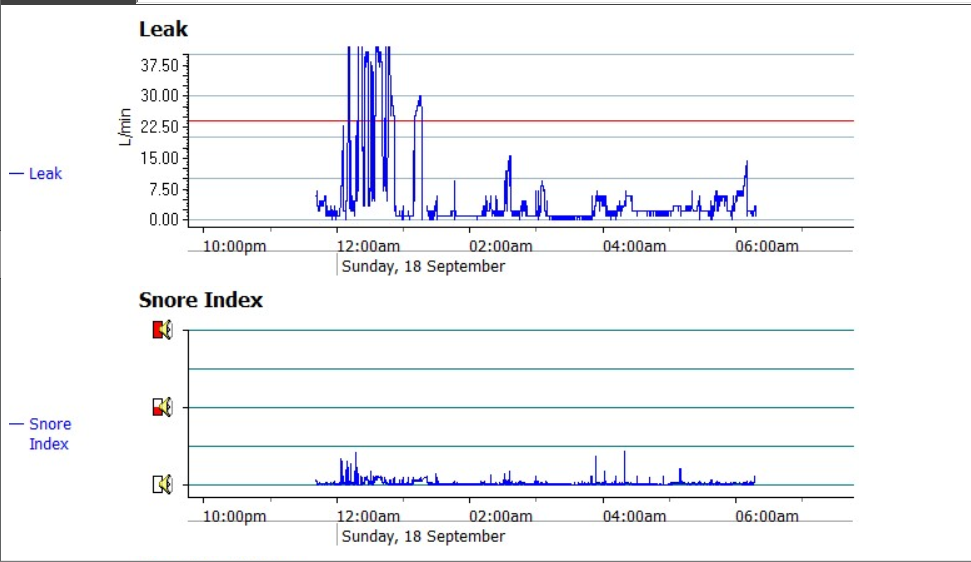
Notice: the mouth leaks at 12:00 AM of close to 40 L/Min did not disturb the S9 Autoset from doing its job.
All are ResScan:
Notice: the mouth leaks at 12:00 AM of close to 40 L/Min did not disturb the S9 Autoset from doing its job.
_________________
| Mask: Mirage™ SoftGel Nasal CPAP Mask with Headgear |
| Humidifier: S9™ Series H5i™ Heated Humidifier with Climate Control |
| Additional Comments: S9 Autoset machine; Ruby chinstrap under the mask straps; ResScan 5.6 |
see my recent set-up and Statistics:
http://i.imgur.com/TewT8G9.png
see my recent ResScan treatment results:
http://i.imgur.com/3oia0EY.png
http://i.imgur.com/QEjvlVY.png
http://i.imgur.com/TewT8G9.png
see my recent ResScan treatment results:
http://i.imgur.com/3oia0EY.png
http://i.imgur.com/QEjvlVY.png
Re: SleepyHead-Any chart for "Time over red line"?
avi, your drool bucket is full, call your nurse.avi123 wrote:I read the length of time above the red line from the ResScan chart.
there's no evidence of that there.avi123 wrote:Notice: the mouth leaks at 12:00 AM of close to 40 L/Min did not disturb the S9 Autoset from doing its job.
Get OSCAR
Accounts to put on the foe list: dataq1, clownbell, gearchange, lynninnj, mper!?, DreamDiver, Geer1, almostadoctor, sleepgeek, ajack, stom, mogy, D.H., They often post misleading, timewasting stuff.
Accounts to put on the foe list: dataq1, clownbell, gearchange, lynninnj, mper!?, DreamDiver, Geer1, almostadoctor, sleepgeek, ajack, stom, mogy, D.H., They often post misleading, timewasting stuff.
Re: SleepyHead-Any chart for "Time over red line"?
[quote="avi123"……[/quote]avi123 wrote:I read the length of time above the red line from the ResScan chart.
All are ResScan:
…
Hi avi,
Just wondering if you had the answer to my question:
hidden there in your reply somewhere, and I somehow missed it?I know the number appears in daily view, but since I personally choose to concentrate on that number a lot in trying to control mask leak, it would be helpful to see it charted in waveform over a number of days, or perhaps even a month, at a single glance.
Nate
_________________
| Mask: DreamWear Nasal CPAP Mask with Headgear |
| Additional Comments: ResMed AirCurve 10 ASV; Dreamwear Nasal Mask Original; CPAPMax Pillow; ResScan & SleepyHead |
Central sleep apnea AHI 62.6 pre-VPAP. Now 0 to 1.3
Present Rx: EPAP: 8; IPAPlo:11; IPAPHi: 23; PSMin: 3; PSMax: 15
"I've had a perfectly wonderful evening, but this wasn't it." —Groucho Marx
Present Rx: EPAP: 8; IPAPlo:11; IPAPHi: 23; PSMin: 3; PSMax: 15
"I've had a perfectly wonderful evening, but this wasn't it." —Groucho Marx
Re: SleepyHead-Any chart for "Time over red line"?
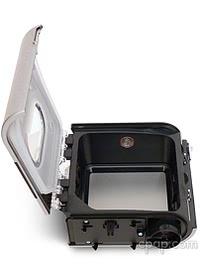
Hi Nate, I think that the leak shown in my above ResScan chart is from the pipe nipple in the S9 humidifier case connecting the humidifier housing to the air hose. It is mounted in the black lower part under the cover. I can hear air leaking sounds there. For some reasons this connector became lose.
I don't reply to your question b/c I don't understand it.
I don't reply to your question b/c I don't understand it.
_________________
| Mask: Mirage™ SoftGel Nasal CPAP Mask with Headgear |
| Humidifier: S9™ Series H5i™ Heated Humidifier with Climate Control |
| Additional Comments: S9 Autoset machine; Ruby chinstrap under the mask straps; ResScan 5.6 |
see my recent set-up and Statistics:
http://i.imgur.com/TewT8G9.png
see my recent ResScan treatment results:
http://i.imgur.com/3oia0EY.png
http://i.imgur.com/QEjvlVY.png
http://i.imgur.com/TewT8G9.png
see my recent ResScan treatment results:
http://i.imgur.com/3oia0EY.png
http://i.imgur.com/QEjvlVY.png
Re: SleepyHead-Any chart for "Time over red line"?
that's never stopped you before.avi123 wrote:I don't reply to your question b/c I don't understand it.
Get OSCAR
Accounts to put on the foe list: dataq1, clownbell, gearchange, lynninnj, mper!?, DreamDiver, Geer1, almostadoctor, sleepgeek, ajack, stom, mogy, D.H., They often post misleading, timewasting stuff.
Accounts to put on the foe list: dataq1, clownbell, gearchange, lynninnj, mper!?, DreamDiver, Geer1, almostadoctor, sleepgeek, ajack, stom, mogy, D.H., They often post misleading, timewasting stuff.

Re: SleepyHead-Any chart for "Time over red line"?
Hi Nate,
I think I know what you want but I don't know of any way to get it short of manually entering the data into some sort of graphing program daily and that's probably more work than you want to do.
I don't know if the csv data files will do it or not. Worth a shot if you know how to do that sort of charting/graphing though.
The time over the red line % statistic is something that SleepyHead calculates and isn't something readily recorded by the machine and shown in ResScan.
Encore used to show it as so many minutes in large leak from the Respironics machines but Resmed/ResScan doesn't seem to offer that little tidbit of information.
I don't remember if Encore still does it or not. Some of the data points we used to get no longer show up and I don't remember for sure about the so many minutes in large leak. Wouldn't matter to you anyway since you don't have a Respironics machine.
_________________
| Machine: AirCurve™ 10 VAuto BiLevel Machine with HumidAir™ Heated Humidifier |
| Additional Comments: Mask Bleep Eclipse https://bleepsleep.com/the-eclipse/ |
I may have to RISE but I refuse to SHINE.
If you want to try the Eclipse mask and want a special promo code to get a little off the price...send me a private message.
If you want to try the Eclipse mask and want a special promo code to get a little off the price...send me a private message.
Re: SleepyHead-Any chart for "Time over red line"?
Thanks very much for your reply and for understanding my interest. I became convinced some time ago, likely from a study of your previous posts, that the "Time over red line" percentage is a much better guide to keeping leaks minimal than caring about the 95% Leak Rate. As long as the TORL as a percentage of total sleep time (aka "Large Leak" in SH) remains tiny, I don't worry about the 95% Leak Rate and rarely even look at it anymore except out of curiosity or concern when the TORL jumps.Pugsy wrote:Hi Nate,
I think I know what you want but I don't know of any way to get it short of manually entering the data into some sort of graphing program daily and that's probably more work than you want to do.
I don't know if the csv data files will do it or not. Worth a shot if you know how to do that sort of charting/graphing though.
The time over the red line % statistic is something that SleepyHead calculates and isn't something readily recorded by the machine and shown in ResScan.….
It would be nice to be able now and then to look at a TORL trendline, so I think I might play around with your suggestion of a csv export when I have the time and inclination, and see if is workable.
Best wishes, Nate
_________________
| Mask: DreamWear Nasal CPAP Mask with Headgear |
| Additional Comments: ResMed AirCurve 10 ASV; Dreamwear Nasal Mask Original; CPAPMax Pillow; ResScan & SleepyHead |
Central sleep apnea AHI 62.6 pre-VPAP. Now 0 to 1.3
Present Rx: EPAP: 8; IPAPlo:11; IPAPHi: 23; PSMin: 3; PSMax: 15
"I've had a perfectly wonderful evening, but this wasn't it." —Groucho Marx
Present Rx: EPAP: 8; IPAPlo:11; IPAPHi: 23; PSMin: 3; PSMax: 15
"I've had a perfectly wonderful evening, but this wasn't it." —Groucho Marx
Re: SleepyHead-Any chart for "Time over red line"?
Okay, a csv export produces these columns:NateS wrote:… I think I might play around with your suggestion of a csv export when I have the time and inclination, and see if is workable.
Total Time
AHI
H Count
OA Count
UA Count
CA Count
VS Count
VS2 Count
RE Count
FL Count
SA Count
NR Count
EP Count
LF Count
UF1 Count
UF2 Count
PP Count
Pressure
Avg
IPAP
Avg
EPAP
Avg
Pressure 1%
IPAP 1%
EPAP 1%
Any help on selecting which of those components and formula produces "Time over red line" would be gratefully appreciated.
Regards, Nate
_________________
| Mask: DreamWear Nasal CPAP Mask with Headgear |
| Additional Comments: ResMed AirCurve 10 ASV; Dreamwear Nasal Mask Original; CPAPMax Pillow; ResScan & SleepyHead |
Central sleep apnea AHI 62.6 pre-VPAP. Now 0 to 1.3
Present Rx: EPAP: 8; IPAPlo:11; IPAPHi: 23; PSMin: 3; PSMax: 15
"I've had a perfectly wonderful evening, but this wasn't it." —Groucho Marx
Present Rx: EPAP: 8; IPAPlo:11; IPAPHi: 23; PSMin: 3; PSMax: 15
"I've had a perfectly wonderful evening, but this wasn't it." —Groucho Marx
Re: SleepyHead-Any chart for "Time over red line"?
er, none of 'em. if there was a 'duration of large leaks' that could do it, divided by total time.NateS wrote:Okay, a csv export produces these columns:NateS wrote:… I think I might play around with your suggestion of a csv export when I have the time and inclination, and see if is workable.
... Any help on selecting which of those components and formula produces "Time over red line" would be gratefully appreciated.
Regards, Nate
it *might* not be that hard for someone with a bit of c++ knowledge to code in what you want.
Get OSCAR
Accounts to put on the foe list: dataq1, clownbell, gearchange, lynninnj, mper!?, DreamDiver, Geer1, almostadoctor, sleepgeek, ajack, stom, mogy, D.H., They often post misleading, timewasting stuff.
Accounts to put on the foe list: dataq1, clownbell, gearchange, lynninnj, mper!?, DreamDiver, Geer1, almostadoctor, sleepgeek, ajack, stom, mogy, D.H., They often post misleading, timewasting stuff.
Re: SleepyHead-Any chart for "Time over red line"?
You could use Excel or some other spreadsheet to calculate something like Time Over Red Line if you have detailed leak data over time.NateS wrote:Okay, a csv export produces these columns:
...
Regards, Nate
I took a look at what my version of SleepyHead exported via CSV and while pressure over time data exists there is no leak data. The CSV data you mentioned is actually summary data and there is no way to get a chart from that.
So palerider is right it will require grabbing the SleepyHead source and learning c++ (if that is what SleepyHead is written in) to add your chart.
_________________
| Machine: ResMed AirSense™ 10 AutoSet™ CPAP Machine with HumidAir™ Heated Humidifier |
| Mask: AirFit™ P10 Nasal Pillow CPAP Mask with Headgear |
| Additional Comments: HST AHI 40, Pres 9-20, SleepyHead v1.0.0-beta-2 |
-
Jay Aitchsee

- Posts: 2936
- Joined: Sun May 22, 2011 12:47 pm
- Location: Southwest Florida
Re: SleepyHead-Any chart for "Time over red line"?
You can get closer with ResScan. It will export patient Summary Data for a chosen time period. The data includes "leak", but I don't know what that represents. It might be 95%, median, max, or ? I doubt the detail is fine enough for your purposes, but it might provide some insight. The only advantage I see that it offers is that it is in chartable, csv, format.
_________________
| Mask: AirFit™ P10 Nasal Pillow CPAP Mask with Headgear |
| Additional Comments: S9 Auto, P10 mask, P=7.0, EPR3, ResScan 5.3, SleepyHead V1.B2, Windows 10, ZEO, CMS50F, Infrared Video |