Chartism fun: my first night of sleep data

General Discussion on any topic relating to CPAP and/or Sleep Apnea.
patrissimo
Posts: 186
Joined: Tue Dec 11, 2012 3:07 pm

Chartism fun: my first night of sleep data

Post by patrissimo » Sat Jan 19, 2013 4:05 pm

I got my first night of high-res data in SleepyHead (I can run ResMed in Crossover on my mac, and it sees the SD card, but then hangs trying to import data from it). I'm not really sure what to make of it. I'm dispirited that my AHI is so low (0.2) when I a) still feel like I had poor, broken sleep, b) woke up several times to go to the bathroom, with that feeling of "my bladder isn't full but I got yanked out of sleep by something, most likely by breathing problems". Do I have UARS, as the Stanford doctors have said? Or should I give up on SDB as an explanation of my unrefreshing sleep, and try sleep restriction therapy? I'm not ready for that yet, and want some feedback.

More of my background can be found here: viewtopic.php?f=1&t=85661&st=0&sk=t&sd=a

Some background before the charts & questions:
- The S9 only flagged 2 events for me all night, one obstructive & one central.
- However, using Sleepyheads user flagging, if I do 5s 20% FL as an event, I get 4 or so, if I do 4s 20% FL, I get about 15-20.
- The S9 seems to score Hypnopneas differently (either that or it is eliminating them totally, but I'm skeptical) than my S7 AutoSet. My AI during my several weeks of CPAP so far has been about 0.1 - 1.3, with my HI 1 - 3, so AHI about 1 - 4. Those hypnopneas are not showing up in the S9 data. The 0.2 AI is consistent with my S7 summary data, but the 0.0 HI is not consistent.
- I find it really interesting that I had a central-flagged event, will see what happens as I increase pressures.
- My 2-year old woke me up at 2am for about half an hour, that's the big missing chunk on the flow graph. The other 3 short missing chunks were nocturias.
- My Zeo only recorded a few hours of data, that's why I didn't include it (also when I imported it, it seemed to bring in zero-data for several hours after I woke up that messed up the other graphs, ie adding an empty area on the right of several hours).

Here's the full-night data, I'll make comments about it, then post the zoom-ins in another thread.

Image
Image
Image

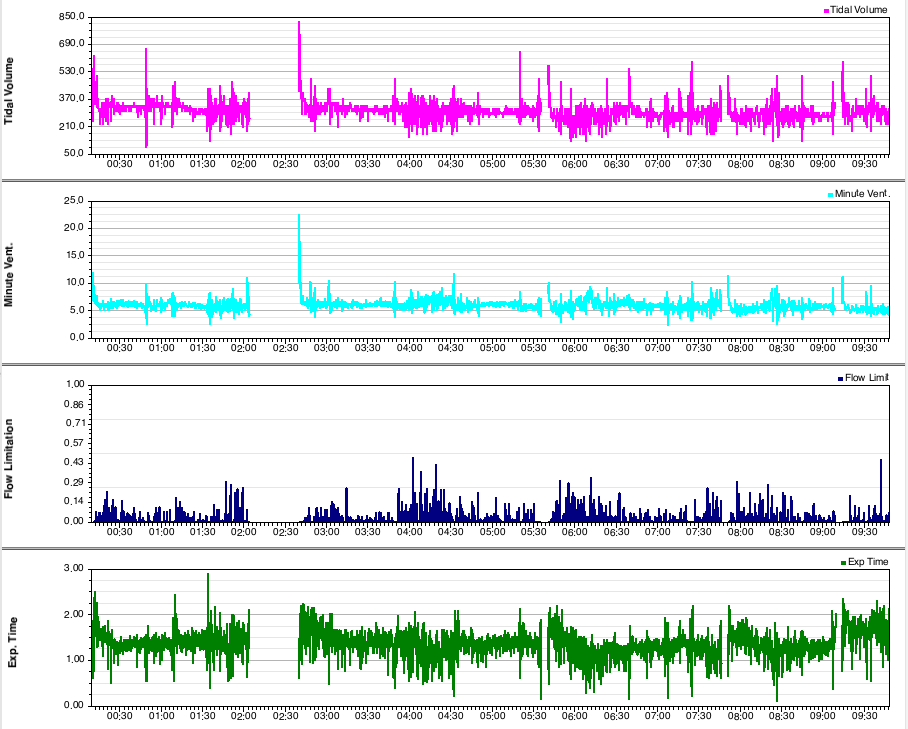
Observations & questions:
- I had the ramp set from 4 for 45 minutes, I didn't realize it would re-start the ramp every time I went to the bathroom, that's unnecessary at my low min pressure (8) and keeps me at a low pressure for a noticeable portion of my therapy time. Turned it down to 5 minutes today.
- I don't know how to interpret the FL graph, which is of course what I'm most interested in given my UARS concern. I've seen others posted which are better, and which are worse. It's certainly pretty far from flat 0s, but the worst spike are "only" to 0.30 - 0.40 - is that bad?
- The SH summary data for FL says max is 0.22, how is that possible when the graph shows numerous clear spikes above 0.30?
- The machine is reaching my max pressure of 12 (set b/c I had runaway pressure the last few days to 14 & 16 which gave me aerophagia and was uncomfortable). Seems like I should try 13 and work on getting used to higher pressures.
- At these low pressures I don't think I need the EPR, and when I zoom into events, they seem to happen on expiration, with the very low EPR pressure, so I think it may be affecting me, and I'm turning it off.

Ok, zoom-ins next...

_________________
MaskHumidifier
Additional Comments: Surgeries: MMA, tonsils/adenoids, septoplasty/turbinate

patrissimo
Posts: 186
Joined: Tue Dec 11, 2012 3:07 pm

Re: Chartism fun: my first night of sleep data

Post by patrissimo » Sat Jan 19, 2013 4:23 pm

Ok, now for the zoom-ins.

First user-flagged event.

Image

Not much to say other than that my respirations don't like anything near sinusoidal - but not sure how flat they are compared to normalized breathing or what others have. This seems to be a breathing pause of about 5 seconds, not associated with a flow limitation (FL came after) would that make it a short central? A hypnopnea?

Image

Second UF event, a similar breathing pause of about 8 seconds, not associated with an FL.

Image

The one machine-flagged OA, looks very similar to the UFs except longer, about 11 seconds. Breathing before looks very sharp. Why is it scored as an OA when the FL graph is zero?

Image

And the machine-flagged CA. This was about 12 seconds, with shallow breathing afterwards. It's embedded in a short pattern you can see 2-3 of in this image, where my breathing amplitude rises and falls and repeats. This looks to me like very mild Cheyne-Stokes, but perhaps I'm seeing things.

Curious whether anyone can make anything of this. I'm going to turn off EPR & ramping, and gradually work up in min/max pressure, see what happens...

_________________
MaskHumidifier
Additional Comments: Surgeries: MMA, tonsils/adenoids, septoplasty/turbinate

patrissimo
Posts: 186
Joined: Tue Dec 11, 2012 3:07 pm

Re: Chartism fun: my first night of sleep data

Post by patrissimo » Sat Jan 19, 2013 4:30 pm

And just for fun for fellow UARSers out there - a period of significant FL spiking to 0.43:

Image

You can see how my breathing is visible different there, shorter and flatter-topped. But no apnea. The same thing happens when my FL spikes to 0.3. My zeo data doesn't seem to have anywhere near the same resolution - I guess it is only reporting in 5-minute intervals - so I can't tell whether these periods are associated with movement to light slee . But it seems to me that these sorts of events are consistent with UARS-style SDB - noticeable change in breathing pattern without an actual stoppage of breath, what do y'all think?

Hopefully increasing pressure will improve this FL graph...my median is 0.0, but my 95% is 0.09 according to SH (though my max is erroneous at 0.22, so dunno if I believe the 95%), so I will look to see those improve.

_________________
MaskHumidifier
Additional Comments: Surgeries: MMA, tonsils/adenoids, septoplasty/turbinate

User avatar
SleepingUgly
Posts: 4690
Joined: Sat Nov 28, 2009 9:32 pm

Re: Chartism fun: my first night of sleep data

Post by SleepingUgly » Sat Jan 19, 2013 10:40 pm

patrissimo wrote:I don't know how to interpret the FL graph, which is of course what I'm most interested in given my UARS concern. I've seen others posted which are better, and which are worse. It's certainly pretty far from flat 0s, but the worst spike are "only" to 0.30 - 0.40 - is that bad?
I don't think anyone knows whether the kind of FLs you have (and you do have them) are causing your EDS. You can try to increase the pressure and see if it improves the flow curve, although you may hit a point where aerophagia becomes problematic, as you noted.
Never put your fate entirely in the hands of someone who cares less about it than you do. --Sleeping Ugly

User avatar
kaiasgram
Posts: 3569
Joined: Sat Jun 02, 2012 2:08 pm
Location: Northern California

Re: Chartism fun: my first night of sleep data

Post by kaiasgram » Sat Jan 19, 2013 11:50 pm

patrissimo wrote: - I don't know how to interpret the FL graph, which is of course what I'm most interested in given my UARS concern. I've seen others posted which are better, and which are worse. It's certainly pretty far from flat 0s, but the worst spike are "only" to 0.30 - 0.40 - is that bad?
Hi patrissimo, I have come to the conclusion that the FL graph is one of the great mysteries of life! So are the FL numbers we see on the reports. I have yet to find a reference range for them. My 95% FL is usually .15 to .19 and my Max FL runs .35 to .39. My resp waveform looks pretty funky when FL increases, a lot like the graphs you posted. I'm glad you asked specifically about the FL report, let's hope someone can shed more light on this.

_________________
Machine: AirSense 10 AutoSet with Heated Humidifer + Aifit N30i Nasal Mask Bundle
Additional Comments: SleepyHead-now-OSCAR software on Mac OSX Ventura

patrissimo
Posts: 186
Joined: Tue Dec 11, 2012 3:07 pm

Re: Chartism fun: my first night of sleep data

Post by patrissimo » Sun Jan 20, 2013 12:05 am

kaiasgram wrote:Hi patrissimo, I have come to the conclusion that the FL graph is one of the great mysteries of life! So are the FL numbers we see on the reports. I have yet to find a reference range for them. My 95% FL is usually .15 to .19 and my Max FL runs .35 to .39. My resp waveform looks pretty funky when FL increases, a lot like the graphs you posted. I'm glad you asked specifically about the FL report, let's hope someone can shed more light on this.
Thanks for the reply. What have you found to decrease your FL? Higher pressure? Do you notice feeling different during the day if your 95% or Max FL are particularly low or high?

_________________
MaskHumidifier
Additional Comments: Surgeries: MMA, tonsils/adenoids, septoplasty/turbinate

User avatar
kaiasgram
Posts: 3569
Joined: Sat Jun 02, 2012 2:08 pm
Location: Northern California

Re: Chartism fun: my first night of sleep data

Post by kaiasgram » Sun Jan 20, 2013 2:12 am

patrissimo wrote:Thanks for the reply. What have you found to decrease your FL? Higher pressure? Do you notice feeling different during the day if your 95% or Max FL are particularly low or high?
My FL numbers don't vary all that much so I haven't been able to identify any relationship between how I feel during the day and what my FL was the night before. I haven't really found anything that decreases my FL significantly, though since the holidays I've gained a few pounds and my FL has gone up a bit (I'll letcha know when I drop those few pounds if my FL goes back down ). As for your question about higher pressure, aerophagia has prevented me from experimenting much with higher pressures, but I do think higher pressure might help. With my S9 Autoset, wherever I've set the max pressure is where my machine will go at night -- in other words, it often bumps along the upper limit I've set which tells me it might want to go even higher if I'd let it. All of this is why my doc had me spend a week with a bipap machine, to see if I could tolerate higher pressure without getting aerophagia. I was able to set IPAP pressure higher and sleep pretty comfortably through it. So I'm currently waiting for my doc to review the results of my week with his machine and hopefully prescribe bipap. Whereas I can't tolerate much above 8.6 or so on my S9, I tolerated a pressure of 10 on bipap.

_________________
Machine: AirSense 10 AutoSet with Heated Humidifer + Aifit N30i Nasal Mask Bundle
Additional Comments: SleepyHead-now-OSCAR software on Mac OSX Ventura

patrissimo
Posts: 186
Joined: Tue Dec 11, 2012 3:07 pm

Re: Chartism fun: my first night of sleep data

Post by patrissimo » Sun Jan 20, 2013 1:19 pm

Thanks Kaiasgram, that's very helpful. Was the bipap machine a resmed with similar data, and if so did the FL look better? Did it feel subjectively better? How many machine-detected apneas & hypnopneas do you have? Your case certainly seems to fit the Dr. Krakow model of FL -> disturbed sleep -> needs higher pressures than CPAP to fully eliminate -> needs BiPap or ASV. I am finding that model fits me as well - I'm trying to crank up APAP pressure and starting to run into discomfort with chipmunk cheeks & aerophagia - and need to decide when/if to get/try a bipap or asv, so I will be very interested to hear about your experience w/ bipap.

_________________
MaskHumidifier
Additional Comments: Surgeries: MMA, tonsils/adenoids, septoplasty/turbinate

patrissimo
Posts: 186
Joined: Tue Dec 11, 2012 3:07 pm

Re: Chartism fun: my first night of sleep data

Post by patrissimo » Sun Jan 20, 2013 2:32 pm

Night 2:
- I turned off EPR
- Upped pressure range from 8-12 to 9-13 (having found 14 & 16 uncomfortable and disruptive to my sleep before)
- My median pressure was 11.02, 95% was the full 13, so the machine spent at least 5% of the night at max pressure.
- Only 1 machine-flagged event - a central - and 4 user-flagged events (all 5-second apneas). The flagged CA was preceded by snoring, which I would think would tend to signal an obstructive event.
- FL was 0.01 median, 0.17 95%, 0.34 max. (again, the graph visibly spikes higher, to 0.50, but Sleepyhead only reports 0.34 as the max).
- My Zeo fell off again (doesn't fit near as well with the Quattro as my old mirage FFM)
- My nose was stuffy and a nostril was clogged several times during the night, I'm fighting off a cold.
- I did not use mouth taping or polident, I've been leaving the mouth unsealed for a few nights now
- I had a brutal period with 4 awakenings in 2 hours from 4:30 - 6:30am, as you can see from the mask pressure graph. The first one was about 5 minutes after my one big snore spike of the night (jumped from 0 to 0.3 - 0.7 for about a minute) and the one machine-flagged event (central), presumably I snored and had an event and woke up. 2 of these were from my cat causing trouble, not sure about the 4th.

I experienced moderate aerophagia and discomfort from the increased pressure, which is unfortunate since based on my FL graph (noticeably worse than the prev night) my SDB is clearly not being controlled . If we look at this through the Barry Krakow lens of "Jack up the pressure until the flow curve is fully rounded. If you hit discomfort, switch to bipap. If that doesn't work, switch to ASV", well, my flow curve is pretty clearly pretty far from normalized, and I'm experiencing discomfort. I should try a few things (mouth taping, opening my nasal airway, acclimatization time at current pressure) to see if I can decrease my FL / tolerate higher pressure, and if not, try bipap.

Image

While I only have partial Zeo data, I compared them a bit and it looks like I may have REM instability. My first period of REM was 2:35am - 3:05am, and you can see on this FL graph of 1:45am (when I fell asleep) to 3:45am (a little after REM ended) that there is a big increase in FL from 2:45am - 3:05am:

Image

The periods of higher FL in the morning, after my Zeo had stopped tracking, likely correspond to REM as well. During these periods, my pressure goes from 10 to the max of 13, but it is not enough to control the FL. Here's an example of what looks to me like a period of good breathing surrounded by SDB on either side, from 7:15am-8:45am. I'd hypothesize that it was a period of NREM, bummer I don't have Zeo data:

Image

This period includes 3 of the 4 user-flagged events (5-10sec apneas):
- The period of 7:35 - 7:45am has very irregular breathing, as seen in the respiration rate, and the 2 events on the flow rate graph, and the raggedness of the flow rate graph. There is no particular FL spike associated with this. Mask pressure is basically constant at 11 during this period, so the machine is not seeing whatever is happening.
- Then from 7:45 - 8:15am there is a period with a remarkably regular respiratory rate, fairly shallow (the tidal volume and exp time graphs look very similar to the resp rate, with a period of constancy), flow rate looks very regular no big spikes.
- Then at 8:16:15am there is a 7-second apnea, with an unflagged 8 sec one at 8:19:03. During the period from 8:16 - 8:50 shown here, the APAP increases pressure to the max of 13, respiratory rate is very uneven and has high spikes, flow rate is uneven, and flow limitations jump from under 0.15 to regular spikes over 0.25 and several over 0.45. So the machine is seeing whatever is happening, but unable to increase pressure enough to treat it.

Finally, here's all of that long SDB period starting at 8:16am, ending at about 9:12am, and the period of non-SDB sleep that followed:

Image

You can see that from 8:16am - 9:12am, resp rate is highly variable and high (shallow breathing) with large spikes, and FL graph is regularly spiking above 0.25 for this entire hour-long period, while the pressure is at the max of 13, and the flow rate looks "ragged". Then the breathing shifts during 9:12am - 9:22am: the flow rate graph looks much more consistent, pressure drops slowly down to 10, the FL graph stays below 0.14, and the respiratory rate graph looks dramatically different, not exceeding 32, and being much more regular. My guess is this was a transition to NREM, but either way, there is a big contrast in the breathing in this period before and after that shift!

Anyway, I may have an AI of just 0.2, or 0.6 with user-flagged 5-10sec apneas, but this sure does not look like consistent and unrestricted nighttime breathing to me. I'm very interested in y'all's opinions, especially anyone who had graphs like this and was able to treat it successfully.

_________________
MaskHumidifier
Additional Comments: Surgeries: MMA, tonsils/adenoids, septoplasty/turbinate

User avatar
kaiasgram
Posts: 3569
Joined: Sat Jun 02, 2012 2:08 pm
Location: Northern California

Re: Chartism fun: my first night of sleep data

Post by kaiasgram » Sun Jan 20, 2013 2:47 pm

patrissimo wrote:Thanks Kaiasgram, that's very helpful. Was the bipap machine a resmed with similar data, and if so did the FL look better? Did it feel subjectively better? How many machine-detected apneas & hypnopneas do you have? Your case certainly seems to fit the Dr. Krakow model of FL -> disturbed sleep -> needs higher pressures than CPAP to fully eliminate -> needs BiPap or ASV. I am finding that model fits me as well - I'm trying to crank up APAP pressure and starting to run into discomfort with chipmunk cheeks & aerophagia - and need to decide when/if to get/try a bipap or asv, so I will be very interested to hear about your experience w/ bipap.
The trial bipap was a PR not a ResMed, which I think makes direct comparison of the data from the two machines very iffy. ResMed gives a Min, Med, 95% and Max FL number and a FL graph. The PR bipap machine gave only one FL number and I'm not sure if it's a median, 95% or max. And no FL graph.

However, looking just at the bipap trial, I did start to see the a decrease in FL and most importantly I slept better and felt better overall while using the bipap.

I wish I'd had another week or two with the bipap machine, but for the 5 nights that I have FL data from it, this is what happened as I tweaked the pressure settings with the machine in auto bipap mode:

EPAP=5, IPAP=9 FL=.95
EPAP=6, IPAP=10 FL=.53
EPAP=6, IPAP=11 FL=.35
EPAP=6, IPAP=11 FL=.11
EPAP=6, IPAP=11 FL=.29

Except for that last night I see a pretty good downward trend in FL as I increased min EPAP and max IPAP.

You asked about my apneas and hypopneas -- my AHI is consistently under 0.5 and almost always it's clear airway 'events' being flagged during transition to sleep or transition to wake in the a.m. I occasionally have a hypopnea or two (mostly since the holiday weight gain), and almost never have an obstructive apnea -- I think I've seen less than a dozen total in my 7.5 months of PAP therapy. So frank events are being treated successfully but my flow rate graph always shows relatively flat-topped waves and what I call wannabe events (they would have been flagged by the machine if they had lasted another second or two).

_________________
Machine: AirSense 10 AutoSet with Heated Humidifer + Aifit N30i Nasal Mask Bundle
Additional Comments: SleepyHead-now-OSCAR software on Mac OSX Ventura